Introduction
In my previous series of posts, I explored Application Aware Routing (AAR) in depth, a key SD-WAN technology that steers traffic over best-performing paths. While AAR has been a fundamental capability for years, the evolution of networking brought new ideas to enhance its effectiveness. This led to the introduction of Enhanced Application Aware Routing (EAAR).
AAR Limitations
Before diving into EAAR, let’s understand why it was created. 🤓
The current AAR implementation measures the path quality using BFD, sending probes at a defined interval (1s by default). Loss, latency and jitter are derived from those packets and these values are placed into rotating buckets to calculate an average tunnel health metric. This process would typically take between 10 to 60 minutes and with some configuration tweaks we could achieve times of 2 to 10 mins.
For those networks that require faster detection, some challenges arise:
- Lowering the hello interval to less than 1s affects the device’s tunnel scale
- Lowering bfd multiplier and poll intervals could lead to false positives, switching traffic even with transient network conditions.
- Switch traffic back and forth, there is no mechanism to determine if a transport is stable again after a network degradation event.
Enhanced AAR
So, what is EAAR and how it improves its predecessor? 🤔
In a nutshell these are the advantages:
- Uses inline data rather than BFD. In other words, the data plane packets are used to measure loss, latency and jitter.
- Steer traffic in seconds rather than minutes
- Dampening implemented for stability purposes, ensuring transports are stable before forwarding traffic through them.
- More accurate measurements of loss, latency and jitter
Breaking It Down
When EAAR is enabled, data packets will be used to measure loss, latency and jitter. Let’s understand the key differences:
Loss measurement
The SD-WAN routers will use inline data along with IPSEC sequence numbers to measure loss.
There is an in-built mechanism that allows the routers to determine if the loss is local to the router
- Local loss - typically due to QoS drops
Or external to the router
- WAN loss - any packet loss outside the router
To calculate the local loss, the router will determine the amount of packets it generated against the amount of packets that actually were sent. To get the WAN loss, peer SD-WAN routers will report the amount of packets received and will use BFD (Path Monitor TLVs) to send this information back to the originating router.
Up to this point, there is an important improvement in how loss measurement is done, however, this could be further improved by leveraging per queue loss measurements. To achieve this, we need to associate an SLA class with an App Probe Class. Let’s see an example.
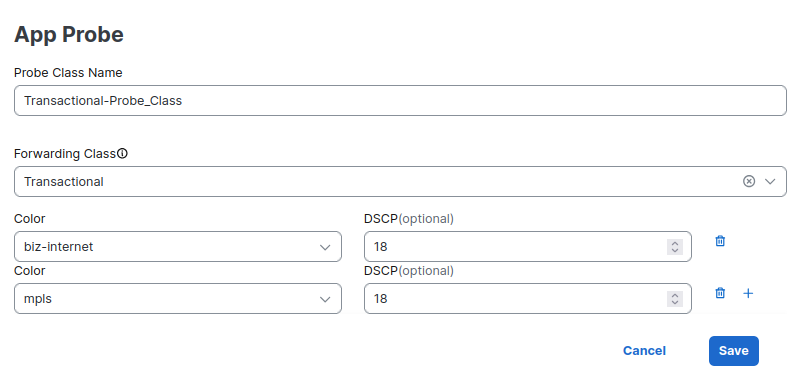
With this App Probe Class, the router will use (and generate BFD) packets with DSCP 18, mimicking less important traffic that will be subject to different rules and paths on the local and external routers. This will provide a more accurate measurement of loss for each type of traffic on the specified transports. If there is no inline data, BFD is used to get measurements.
Note If using GRE, per queue measurement is not available.
Here is a visual to better understand how loss will be measured depending on multiple factors
| Encapsulation | App Probe Class | Measurement type | Public tunnels | Private Tunnels |
|---|---|---|---|---|
| IPsec | Yes | Per SLA | Total WAN loss + local loss per queue | WAN loss per queue + local loss per queue |
| IPsec | No | All SLAs | Total WAN loss + total local loss | Total WAN loss + total local loss |
| GRE | - | All SLAs | Total WAN loss + total local loss | Total WAN loss + total local loss |
Latency
To measure latency, the router will simply calculate the time taken to send and receive packets between source and destination devices. Inline data is used and it can get to App Probe granularity.
Jitter
Another worth mentioning change is that the jitter is computed per direction (receive or transmit). The jitter is computed at the receiver and reported to the sender using BFD TLVs. Inline data is used and BFD is the fallback mechanism if no data traffic is available.
SLA Dampening
One of the benefits of EAAR is steering traffic in seconds rather than minutes, but what would happen if there are transient network conditions causing the transports to not meet the sla every few minutes? Traffic would be constantly switching between transports which is not a desirable scenario and the reason why dampening was introduced.
The general idea is that when a transport link goes out of compliance, traffic is rerouted to an alternate path. Once the transport becomes compliant again, the device does not immediately move traffic back. Instead, it starts a timer to ensure the link remains stable for a specified period before reusing it.
In the end, dampening helps prevent unnecessary traffic shifts, which could negatively impact performance due to transport instability
Configuring EAAR
To enable EAAR we have three predefined options:
| Mode | Poll Interval | Poll Multiplier | Dampening Multiplier |
|---|---|---|---|
| Aggressive | 10s | 6 (10s-60s) | 120 (20 mins) |
| Moderate | 60s | 5 (60s-300s) | 40 (40 mins) |
| Conservative | 300s | 6 (300s-1800s) | 12 (60 mins) |
Note To use custom timers, configuration needs to be done through CLI templates.
EAAR follows the same fundamental principle as AAR, using rotating buckets to calculate average loss, latency, and jitter. With the Aggressive mode, traffic would take between 10-60 seconds to shift, depending on how severe the impairment is.
The dampening window (poll interval x dampening multiplier) is 1200 seconds, meaning that before switching traffic back to a transport, it needs to be stable for 20 minutes.
In my lab, I am using Configuration Groups, however this is available through templates as well.
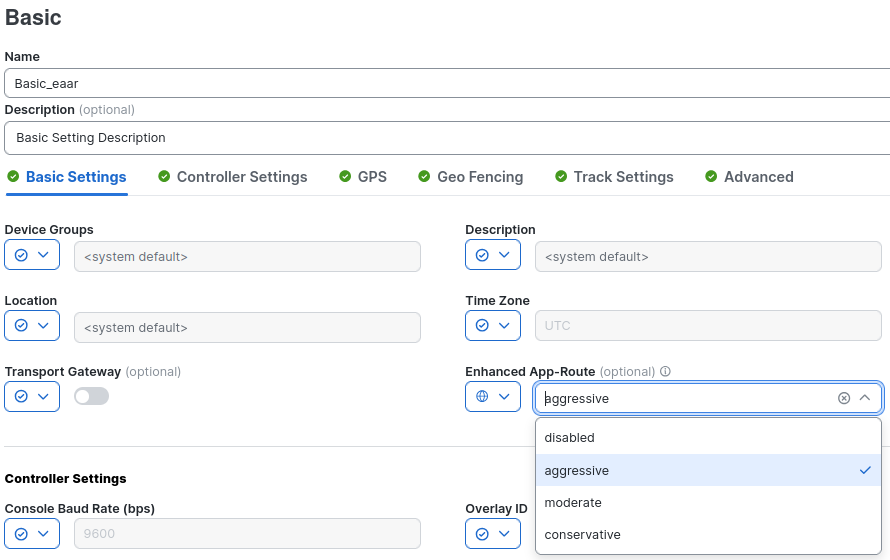
You can use a variable, instead of a global value, to account for devices that will not be running EAAR. In this case, EAAR enabled devices will fallback to AAR.
The following config is added to the devices:
  bfd enhanced-app-route enable
  bfd enhanced-app-route pfr-poll-interval 10000
  bfd enhanced-app-route pfr-multiplier 6
  bfd sla-dampening enable
  bfd sla-dampening multiplier 120
Let’s see how it works
Demo
In my lab, I use Manager 20.16.1 and my devices are running 17.15.1a
Note The minimum version required is 20.12/17.12
Let’s start with some verifications after pushing the configuration.
To check the configured timers and multipliers
BR10#show sdwan app-route params
Enhanced Application-Aware routing
    Config:                  :Enabled
    Poll interval:           :10000
    Poll multiplier:         :6

App route
    Poll interval:           :120000
    Poll multiplier:         :5

SLA dampening
    Config:                  :Enabled
    Multiplier:              :120
To verify what BFD sessions are using EAAR, look for the FLAGS column
BR10#show sdwan bfd sessions alt

                                  SOURCE TLOC      REMOTE TLOC                     DST PUBLIC    DST PUBLIC
SYSTEM IP   SITE ID   STATE       COLOR            COLOR            SOURCE IP      IP            PORT        ENCAP  BFD-LD    FLAGS   UPTIME
-------------------------------------------------------------------------------------------------------------------------------------------------
1.1.1.20    200       up          biz-internet     biz-internet     30.1.10.2      30.1.20.2     12406       ipsec  20006     EAAR    0:00:20:31
1.1.1.20    200       up          mpls             mpls             30.2.10.2      30.2.20.2     12366       ipsec  20002     EAAR    0:00:20:38
1.1.1.20    200       up          private1         private1         30.3.10.2      30.3.20.2     12366       ipsec  20003     EAAR    0:00:20:37
To get more details about a specific tunnel.
BR10#show sdwan app-route stats summary
Generating output, this might take time, please wait ...
app-route statistics 30.1.10.2 30.1.20.2 ipsec 12386 12406
 remote-system-ip         1.1.1.20
 local-color              biz-internet
 remote-color             biz-internet
 sla-class-index          0,1,2
 fallback-sla-class-index None
 enhanced-app-route       Enabled
 sla-dampening-index      None
 app-probe-class-list None
  mean-loss    0.000
  mean-latency 0
  mean-jitter  0
       TOTAL                       AVERAGE  AVERAGE  TX DATA       RX DATA       IPV6 TX       IPV6 RX
INDEX  PACKETS       LOSS          LATENCY  JITTER   PKTS          PKTS          DATA PKTS     DATA PKTS
-------------------------------------------------------------------------------------------------------------
0      0             0             0        0        0             0             0             0
1      64            0             0        0        0             0             0             0
2      0             0             0        0        0             0             0             0
3      0             0             0        0        0             0             0             0
4      0             0             0        0        0             0             0             0
5      64            0             0        0        0             0             0             0
Notice that there is no traffic between my devices, thus the total packet count on each bucket is low.
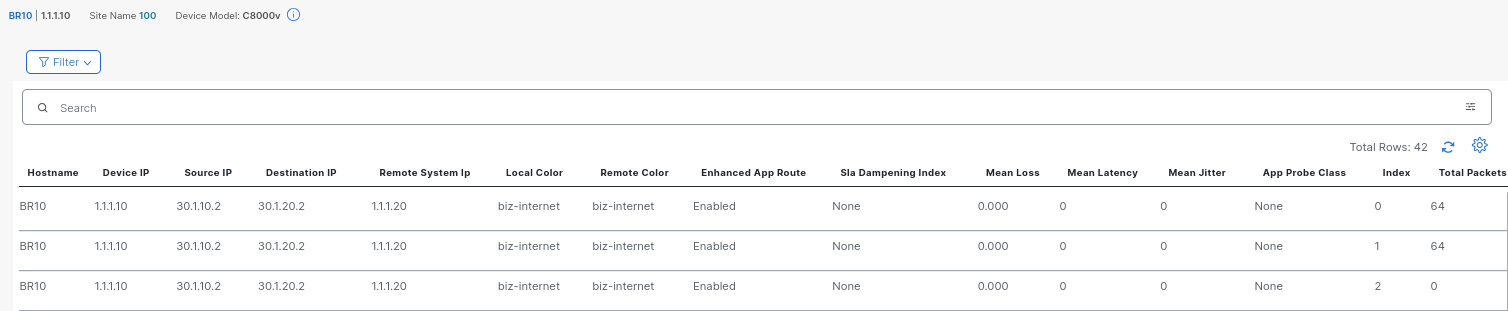
Same information is available through the Manager’s UI, using the Real Time dashboard and using the App Routes Statistics Device Option.
Scenario 1 - Slight impairment
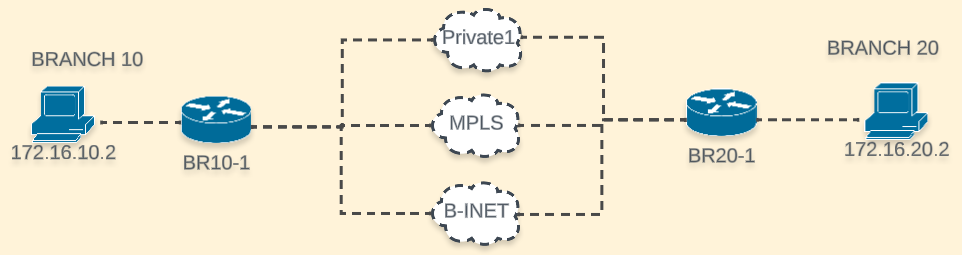
This is my lab’s topology
For this first test, I will use the following SLA parameters:
SLA_Real-Time
Loss: 3%
Latency: 150ms
Jitter: 100ms
The AAR policy from the Controller instructs:
- Use mpls as primary path
- If no color meets the SLA and private1 is available, use it.
- If private1 is not available, load-balance among all remaining colors.
I am matching traffic between 172.16.10.0/24 and 172.16.20.0/24.
BR10#show sdwan policy from-vsmart
from-vsmart app-route-policy app_route_AAR
 vpn-list vpn_Corporate_Users
  sequence 1
   match
    source-data-prefix-list      BR10
    destination-data-prefix-list BR20
   action
    backup-sla-preferred-color private1
    sla-class       SLA_Real-Time
    no sla-class strict
    sla-class preferred-color mpls
  sequence 11
   match
    source-data-prefix-list      BR20
    destination-data-prefix-list BR10
   action
    backup-sla-preferred-color private1
    sla-class       SLA_Real-Time
    no sla-class strict
    sla-class preferred-color mpls
Initial state without network issues
BR10#show sdwan app-route stats summary | i color|damp|mean
 local-color              biz-internet
 remote-color             biz-internet
 sla-dampening-index      None
  mean-loss    0.000
  mean-latency 1
  mean-jitter  0
 local-color              mpls
 remote-color             mpls
 sla-dampening-index      None
  mean-loss    1.212
  mean-latency 1
  mean-jitter  0
  mean-loss    1.212
  mean-latency 1
  mean-jitter  0
 local-color              private1
 remote-color             private1
 sla-dampening-index      None
  mean-loss    0.000
  mean-latency 0
  mean-jitter  0
  mean-loss    0.000
  mean-latency 0
  mean-jitter  0
Notice that the number of packets per bucket increased dramatically
BR10#show sdwan app-route stats remote-color mpls summary
Generating output, this might take time, please wait ...
app-route statistics 30.2.10.2 30.2.20.2 ipsec 12366 12366
 remote-system-ip         1.1.1.20
 local-color              mpls
 remote-color             mpls
 sla-class-index          0,1
 fallback-sla-class-index None
 enhanced-app-route       Enabled
 sla-dampening-index      None
 app-probe-class-list None
  mean-loss    1.176
  mean-latency 0
  mean-jitter  0
       TOTAL                       AVERAGE  AVERAGE  TX DATA       RX DATA       IPV6 TX       IPV6 RX
INDEX  PACKETS       LOSS          LATENCY  JITTER   PKTS          PKTS          DATA PKTS     DATA PKTS
-------------------------------------------------------------------------------------------------------------
0      131136        1501          0        0        100084        20846         0             0
1      131072        1438          0        0        95287         19605         0             0
2      131072        1400          0        0        100985        20937         0             0
3      131072        1781          0        0        85553         18271         0             0
4      64            0             0        0        72618         15942         0             0
5      131072        1589          0        0        65198         14226         0             0
Traffic is using mpls as primary transport
BR10# show sdwan policy service-path vpn 10 interface gigabitEthernet 4 source-ip 172.16.10.10 dest-ip 172.16.20.10 protocol 6 all
Number of possible next hops: 1
Next Hop: IPsec
  Source: 30.2.10.2 12366 Destination: 30.2.20.2 12366 Local Color: mpls Remote Color: mpls Remote System IP: 1.1.1.20
I will introduce 3% packet loss on the mpls transport and see how long it takes to switch traffic. Since there is around 1% loss already, 3% should be enough to trigger a change.
The mpls transport has more than 3% loss
BR10#show sdwan app-route stats remote-color mpls summary
Generating output, this might take time, please wait ...
app-route statistics 30.2.10.2 30.2.20.2 ipsec 12366 12366
 remote-system-ip         1.1.1.20
 local-color              mpls
 remote-color             mpls
 sla-class-index          0
 fallback-sla-class-index 1
 enhanced-app-route       Enabled
 sla-dampening-index      None
 app-probe-class-list None
  mean-loss    3.125          <<<<<<<<<<
  mean-latency 0
  mean-jitter  0
After 56 seconds, the traffic shifted and any of the remaining compliant transports could be used
BR10# show sdwan policy service-path vpn 10 interface gigabitEthernet 4 source-ip 172.16.10.10 dest-ip 172.16.20.10 protocol 6 all
Number of possible next hops: 2
Next Hop: IPsec
  Source: 30.3.10.2 12366 Destination: 30.3.20.2 12366 Local Color: private1 Remote Color: private1 Remote System IP: 1.1.1.20
Next Hop: IPsec
  Source: 30.1.10.2 12386 Destination: 30.1.20.2 12366 Local Color: biz-internet Remote Color: biz-internet Remote System IP: 1.1.1.20
If I take the loss away we can see the dampening mechanism gets activated. So, if the transport is stable for 20 minutes, it will be used again as preferred path.
BR10#show sdwan app-route stats remote-color mpls summary
Generating output, this might take time, please wait ...
app-route statistics 30.2.10.2 30.2.20.2 ipsec 12366 12366
 remote-system-ip         1.1.1.20
 local-color              mpls
 remote-color             mpls
 sla-class-index          0
 fallback-sla-class-index 1
 enhanced-app-route       Enabled
 sla-dampening-index      1        <<<<<<<<<<
 app-probe-class-list None
  mean-loss    0.000
  mean-latency 0
  mean-jitter  0
Scenario 2 - Greater impairment
In this case, I will introduce 10% packet loss to biz-internet transport, making private 1 the only compliant transport.
After around 45 seconds, loss for biz-internet was 12%
BR10#show sdwan app-route stats local-color biz-internet summary
Generating output, this might take time, please wait ...
app-route statistics 30.1.10.2 30.1.20.2 ipsec 12386 12366
 remote-system-ip         1.1.1.20
 local-color              biz-internet
 remote-color             biz-internet
 sla-class-index          0
 fallback-sla-class-index 1
 enhanced-app-route       Enabled
 sla-dampening-index      None
 app-probe-class-list None
  mean-loss    12.500
  mean-latency 0
  mean-jitter  0
Traffic shifted to private1 only
BR10#show sdwan policy service-path vpn 10 interface gigabitEthernet 4 source-ip 172.16.10.10 dest-ip 172.16.20.10 protocol 6 all
Number of possible next hops: 1
Next Hop: IPsec
  Source: 30.3.10.2 12366 Destination: 30.3.20.2 12366 Local Color: private1 Remote Color: private1 Remote System IP: 1.1.1.20
After removing the packet loss, biz-internet has the dampening mechanism activated
BR10#show sdwan app-route stats local-color biz-internet summary
Generating output, this might take time, please wait ...
app-route statistics 30.1.10.2 30.1.20.2 ipsec 12386 12366
 remote-system-ip         1.1.1.20
 local-color              biz-internet
 remote-color             biz-internet
 sla-class-index          0
 fallback-sla-class-index 1
 enhanced-app-route       Enabled
 sla-dampening-index      1         <<<<<<<<<
 app-probe-class-list None
  mean-loss    1.562
  mean-latency 0
  mean-jitter  0
In this case, the time to switch traffic was reduced as a consequence of a greater impairment.
Scenario 3 - Multiple App Probe Classes
For this final scenario, let’s see how to get the most benefit out of EAAR.
The configuration is more complex as it involves QoS, App Probe Classes and AAR Policy.
- QoS is required to classify and send traffic out on different queues.
- App Probes Classes to measure loss, latency and jitter on each of those queues, independently.
My Qos configuration has 3 queues and queue 2 will handle the least important traffic.
- Queue 0 for control traffic
- Queue 1 for Real-Time Traffic (marked DSCP 46)
- Queue 2 for Transactional traffic (marked DSCP 18)
I use a data policy to match traffic on the service side, mark it with the right DSCP and put it on the right forwarding class. I also created a shaper on my mpls interface
To demo things out, I will have two data transfers:
- HTTP GET (port 8000)
- SCP copy (port 22)
My SLAs have the following configurations:
| SLA Class Name | Loss | Latency | Jitter |
|---|---|---|---|
| SLA_Real-Time | 3 % | 150 ms | 100 ms |
| SLA_Transactional | 5 % | 45 ms | 150 ms |
The first thing to note is that my two app probes classes are measured independently. See how the mean loss for Transactional-Probe_Class is 1, whereas for Real_Time_Probe_Class is 0.
BR10#show sdwan app-route stats local-color mpls summary
Generating output, this might take time, please wait ...
app-route statistics 30.2.10.2 30.2.20.2 ipsec 12366 12366
 remote-system-ip         1.1.1.20
 local-color              mpls
 remote-color             mpls
 sla-class-index          0,1,2
 fallback-sla-class-index None
 enhanced-app-route       Enabled
 sla-dampening-index      None
 app-probe-class-list None
  mean-loss    0.000
  mean-latency 1
  mean-jitter  0
       TOTAL                       AVERAGE  AVERAGE  TX DATA       RX DATA       IPV6 TX       IPV6 RX
INDEX  PACKETS       LOSS          LATENCY  JITTER   PKTS          PKTS          DATA PKTS     DATA PKTS
-------------------------------------------------------------------------------------------------------------
0      16384         0             0        0        35827         111807        0             0
1      49152         0             1        0        37788         118236        0             0
2      49216         0             1        0        36859         115551        0             0
3      16384         0             1        0        23894         77280         0             0
4      32768         0             1        1        33179         103759        0             0
5      32768         0             1        0        21485         71702         0             0

 app-probe-class-list Real_Time_Probe_Class
  mean-loss    0.000
  mean-latency 0
  mean-jitter  0
       TOTAL                       AVERAGE  AVERAGE  TX DATA       RX DATA       IPV6 TX       IPV6 RX
INDEX  PACKETS       LOSS          LATENCY  JITTER   PKTS          PKTS          DATA PKTS     DATA PKTS
-------------------------------------------------------------------------------------------------------------
0      0             0             0        0        -             -             -             -
1      32768         0             1        0        -             -             -             -
2      32768         0             0        0        -             -             -             -
3      0             0             0        0        -             -             -             -
4      32768         0             1        2        -             -             -             -
5      0             0             0        0        -             -             -             -

 app-probe-class-list Transactional-Probe_Class
  mean-loss    0.000
  mean-latency 1
  mean-jitter  0
       TOTAL                       AVERAGE  AVERAGE  TX DATA       RX DATA       IPV6 TX       IPV6 RX
INDEX  PACKETS       LOSS          LATENCY  JITTER   PKTS          PKTS          DATA PKTS     DATA PKTS
-------------------------------------------------------------------------------------------------------------
0      16384         0             0        0        -             -             -             -
1      49152         0             1        0        -             -             -             -
2      49216         0             1        0        -             -             -             -
3      16384         0             1        0        -             -             -             -
4      32768         0             1        1        -             -             -             -
5      32768         0             1        0        -             -             -             -
Now, I have lowered my shaper. EAAR was quick to detect a change in latency for the transactional SLA, it is now 53 ms.
BR10# show sdwan app-route stats local mpls summary
Generating output, this might take time, please wait ...
app-route statistics 30.2.10.2 30.2.20.2 ipsec 12386 12366
 remote-system-ip         1.1.1.20
 local-color              mpls
 remote-color             mpls
 sla-class-index          0,1,2
 fallback-sla-class-index None
 enhanced-app-route       Enabled
 sla-dampening-index      None
 app-probe-class-list None
  mean-loss    0.000
  mean-latency 53
  mean-jitter  0
       TOTAL                       AVERAGE  AVERAGE  TX DATA       RX DATA       IPV6 TX       IPV6 RX
INDEX  PACKETS       LOSS          LATENCY  JITTER   PKTS          PKTS          DATA PKTS     DATA PKTS
-------------------------------------------------------------------------------------------------------------
0      2048          0             54       0        4396          8513          0             0
1      1024          0             55       0        4461          8534          0             0
2      8256          0             49       0        4429          8549          0             0
3      16384         0             54       0        4411          8549          0             0
4      0             0             53       0        4440          8549          0             0
5      0             0             54       0        4443          8549          0             0

 app-probe-class-list Real_Time_Probe_Class
  mean-loss    0.000
  mean-latency 0
  mean-jitter  0
       TOTAL                       AVERAGE  AVERAGE  TX DATA       RX DATA       IPV6 TX       IPV6 RX
INDEX  PACKETS       LOSS          LATENCY  JITTER   PKTS          PKTS          DATA PKTS     DATA PKTS
-------------------------------------------------------------------------------------------------------------
0      0             0             0        0        -             -             -             -
1      0             0             0        0        -             -             -             -
2      8192          0             0        0        -             -             -             -
3      16384         0             0        0        -             -             -             -
4      0             0             0        0        -             -             -             -
5      0             0             0        0        -             -             -             -

 app-probe-class-list Transactional-Probe_Class
  mean-loss    0.000
  mean-latency 53    <<<<<<<
  mean-jitter  0
       TOTAL                       AVERAGE  AVERAGE  TX DATA       RX DATA       IPV6 TX       IPV6 RX
INDEX  PACKETS       LOSS          LATENCY  JITTER   PKTS          PKTS          DATA PKTS     DATA PKTS
-------------------------------------------------------------------------------------------------------------
0      2048          0             54       0        -             -             -             -
1      1024          0             55       0        -             -             -             -
2      8256          0             49       0        -             -             -             -
3      16384         0             54       0        -             -             -             -
4      0             0             53       0        -             -             -             -
5      0             0             54       0        -             -             -             -
Now that my Transactional SLA with a maximum latency of 45 ms is not met , I will use NWPI to understand how traffic is getting sent out. Let’s examine HTTP traffic using port 80000
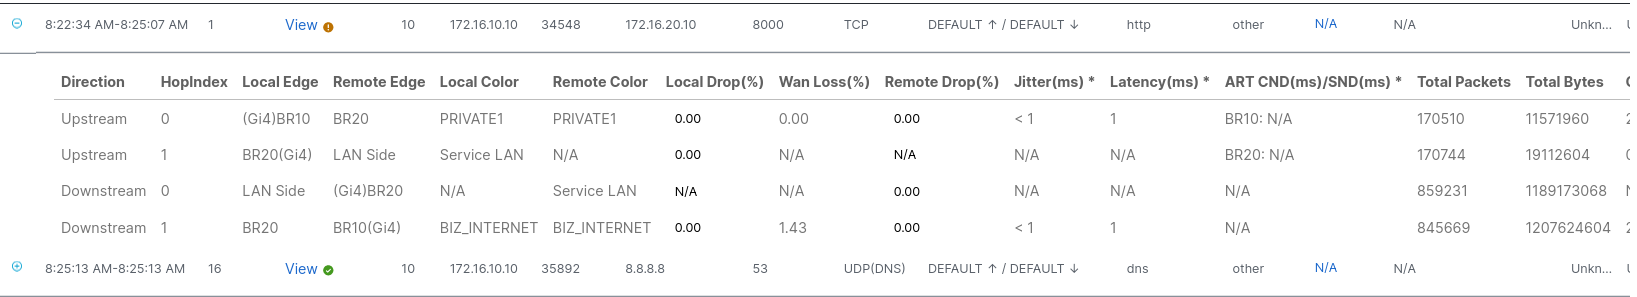
Notice that, on the upstream direction, the local and remote color is set to private1, indicating that traffic has moved away from mpls and its 53 ms latency. Just what we expected ✅
Now, let’s see how traffic on port 22 is flowing
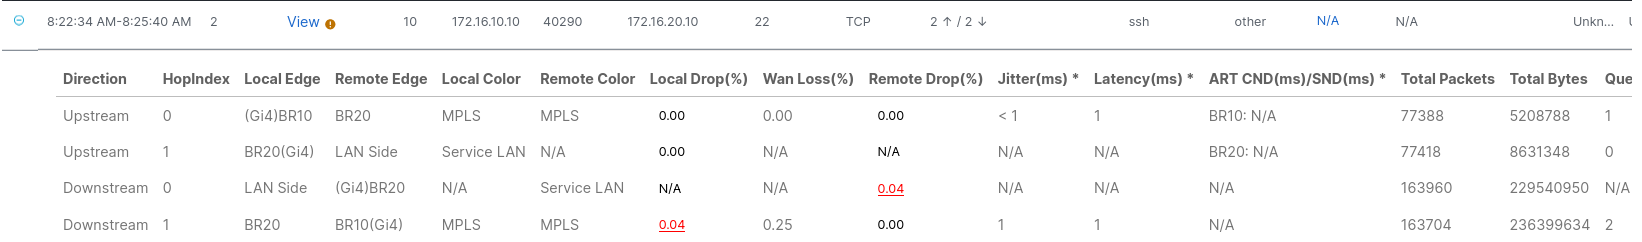
Again, take a look at the upstream local and remote color, notice how mpls is still in use for this traffic, as there are no path issues detected.
In summary, the traffic with dscp 46 is working perfectly fine on the mpls transport, however, traffic with DSCP 18 was having more latency than the configured SLA, so traffic was moved to Private1 as it complies with the SLA.
We can confirm we are measuring and taking routing decisions on a per queue basis, this is a huge difference 🤯 !
Lessons learned
- Using inline data, the number of samples increases dramatically compared to BFD sample size. 📈
- EAAR can steer traffic in seconds, rather than minutes. ⏩
- EAAR delivers the greatest benefits on transports with QoS, such as MPLS. 🚀
- Even on transports without QoS, inline data measurements increases sample size and accuracy. ⏳
- The dampening timer is useful to ensure transports are stable before marking them as valid. ✅
- Interoperability between devices running EAAR and devices running AAR is possible 🔄
I hope you have learned something useful! See you on the next one 👋