Introduction
As networks evolve to provide better user experience and new technologies to manage the network are introduced, maintaining everything running smoothly has become increasingly difficult. One of the critical responsibilities of the operations team is tracking problems happening all over the network. Identifying them is just the beginning, then they need to be logged and driven to resolution. Multiply the amount of actions per incident and you have enough to keep your IT team busy all day long!
In this post I will show you what you need to know to integrate the SD-WAN Manager with ServiceNow for incident management. We will see some of the most common problems in SD-WAN.
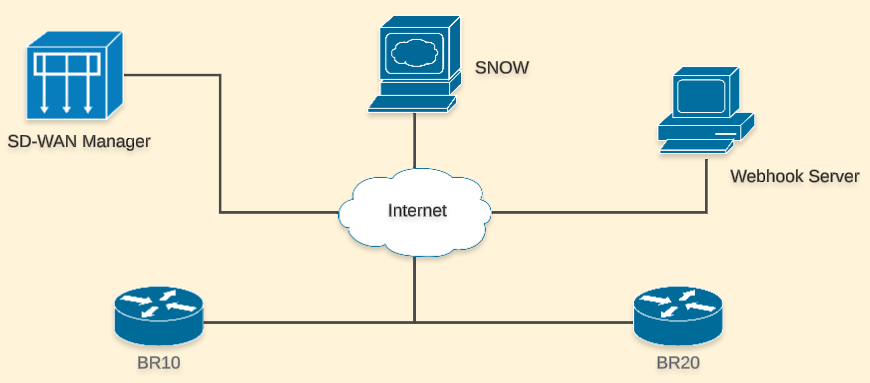
Lab setup
I am using SD-WAN Manager version 20.12.1 and I have a ServiceNow developer instance. My Webhook Server runs in Ubuntu 20.04 LTS and I built the webhook receiver in Go language.
To simplify things, I have direct communication between all the elements of my lab.
Webhooks
Webhooks are a way for web applications to communicate with each other in real-time. They allow one application to send automated notifications to another application when a specific event occurs, it is referred to as push model. This facilitates integration between different systems and can be used to trigger subsequent automated activities. Webhooks typically use HTTP callbacks to share notifications/information.
In our scenario, the SD-WAN Manager will monitor events on BR10 and will send HTTP POST requests to our Webhook Server when specific events occur. This will allow us to manage incidents in ServiceNow.
Anatomy of a Webhook Notification
Let’s understand the structure and information that the SD-WAN Manager will be sharing with our Webhook Server.
This is an example of the information sent when some interface goes down
{
  "suppressed": false,
  "devices": [
    {
      "system-ip": "1.1.10.1"
    }
  ],
  "eventname": "interface-state-change",
  "type": "interface-state-change",
  "rulename": "interface-state-change",
  "component": "VPN",
  "entry_time": 1709277345253,
  "statcycletime": 1709277345253,
  "message": "The interface oper-state changed to down",
  "severity": "Critical",
  "severity_number": 1,
  "uuid": "9e2f7630-d504-4cdf-b808-fc8e29a6dd47",
  "values": [
    {
      "host-name": "BR10",
      "system-ip": "1.1.10.1",
      "if-name": "GigabitEthernet2",
      "new-state": "down",
      "vpn-id": "0"
    }
  ],
  "rule_name_display": "Interface_State_Change",
  "receive_time": 1708843127894,
  "values_short_display": [
    {
      "host-name": "BR10",
      "system-ip": "1.1.10.1",
      "if-name": "GigabitEthernet2",
      "new-state": "down"
    }
  ],
  "system_ip": "1.1.10.1",
  "host_name": "BR10",
  "acknowledged": false,
  "active": true
}
Let’s extract the most important information for us:
"active": true- Do we have a problem? Yes, issue is active or present"message": "The interface oper..."- What is happening?"severity_number": 1- How serious it is? (we chose the number instead of the string on purpose)"uuid": "9e2f7630-d504...d47"- Event identifier used by SD-WAN Manager"system_ip": "1.1.10.1"- What device originated the event?"host_name": "BR10"- More meaningful device identifier for humans
Let’s see the notification when the interface comes up
{
  "suppressed": false,
  "devices": [
    {
      "system-ip": "1.1.10.1"
    }
  ],
  "eventname": "interface-state-change",
  "type": "interface-state-change",
  "rulename": "interface-state-change",
  "component": "VPN",
  "entry_time": 1709277482508,
  "statcycletime": 1709277482508,
  "message": "The interface oper-state changed to up",
  "severity": "Medium",
  "severity_number": 3,
  "uuid": "5486325c-d189-4467-9b5a-16acb1f28ec9",
  "values": [
    {
      "host-name": "BR10",
      "system-ip": "1.1.10.1",
      "if-name": "GigabitEthernet2",
      "new-state": "up",
      "vpn-id": "0"
    }
  ],
  "rule_name_display": "Interface_State_Change",
  "receive_time": 1708843265147,
  "values_short_display": [
    {
      "host-name": "BR10",
      "system-ip": "1.1.10.1",
      "if-name": "GigabitEthernet2",
      "new-state": "up"
    }
  ],
  "system_ip": "1.1.10.1",
  "host_name": "BR10",
  "acknowledged": false,
  "cleared_events": [
    "9e2f7630-d504-4cdf-b808-fc8e29a6dd47"
  ],
  "active": false
}
The two most important things are:
"active": false-Issue is no longer active or present"cleared_events": ["9e2f7630-d504...d47]"-Event ID that is resolved
One thing to know is that not all the events will behave in the same way. Some of them will not have a “cleared_events” entry so we would need to handle them differently if we want to automatically close them. Others might lack certain information depending on what we are monitoring.
Before coding any type of application, it’s important to know what you want to monitor and what you will be getting from the SD-WAN Manager so you can properly handle it.
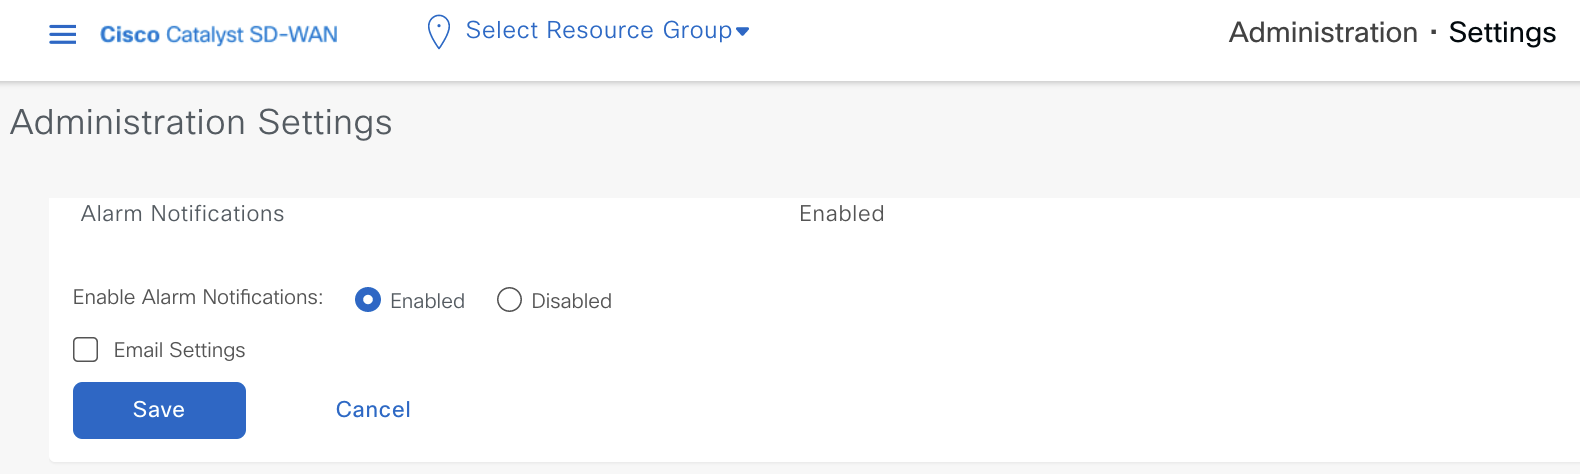
Configure Webhooks on SD-WAN Manager
On 20.12, it’s very simple to configure them, first enable the notification settings from Administration > Settings > Alarm Notifications
Let’s define the rules to trigger our Webhooks. From Monitor > Logs > Alarm notification > Add Alarm Notification
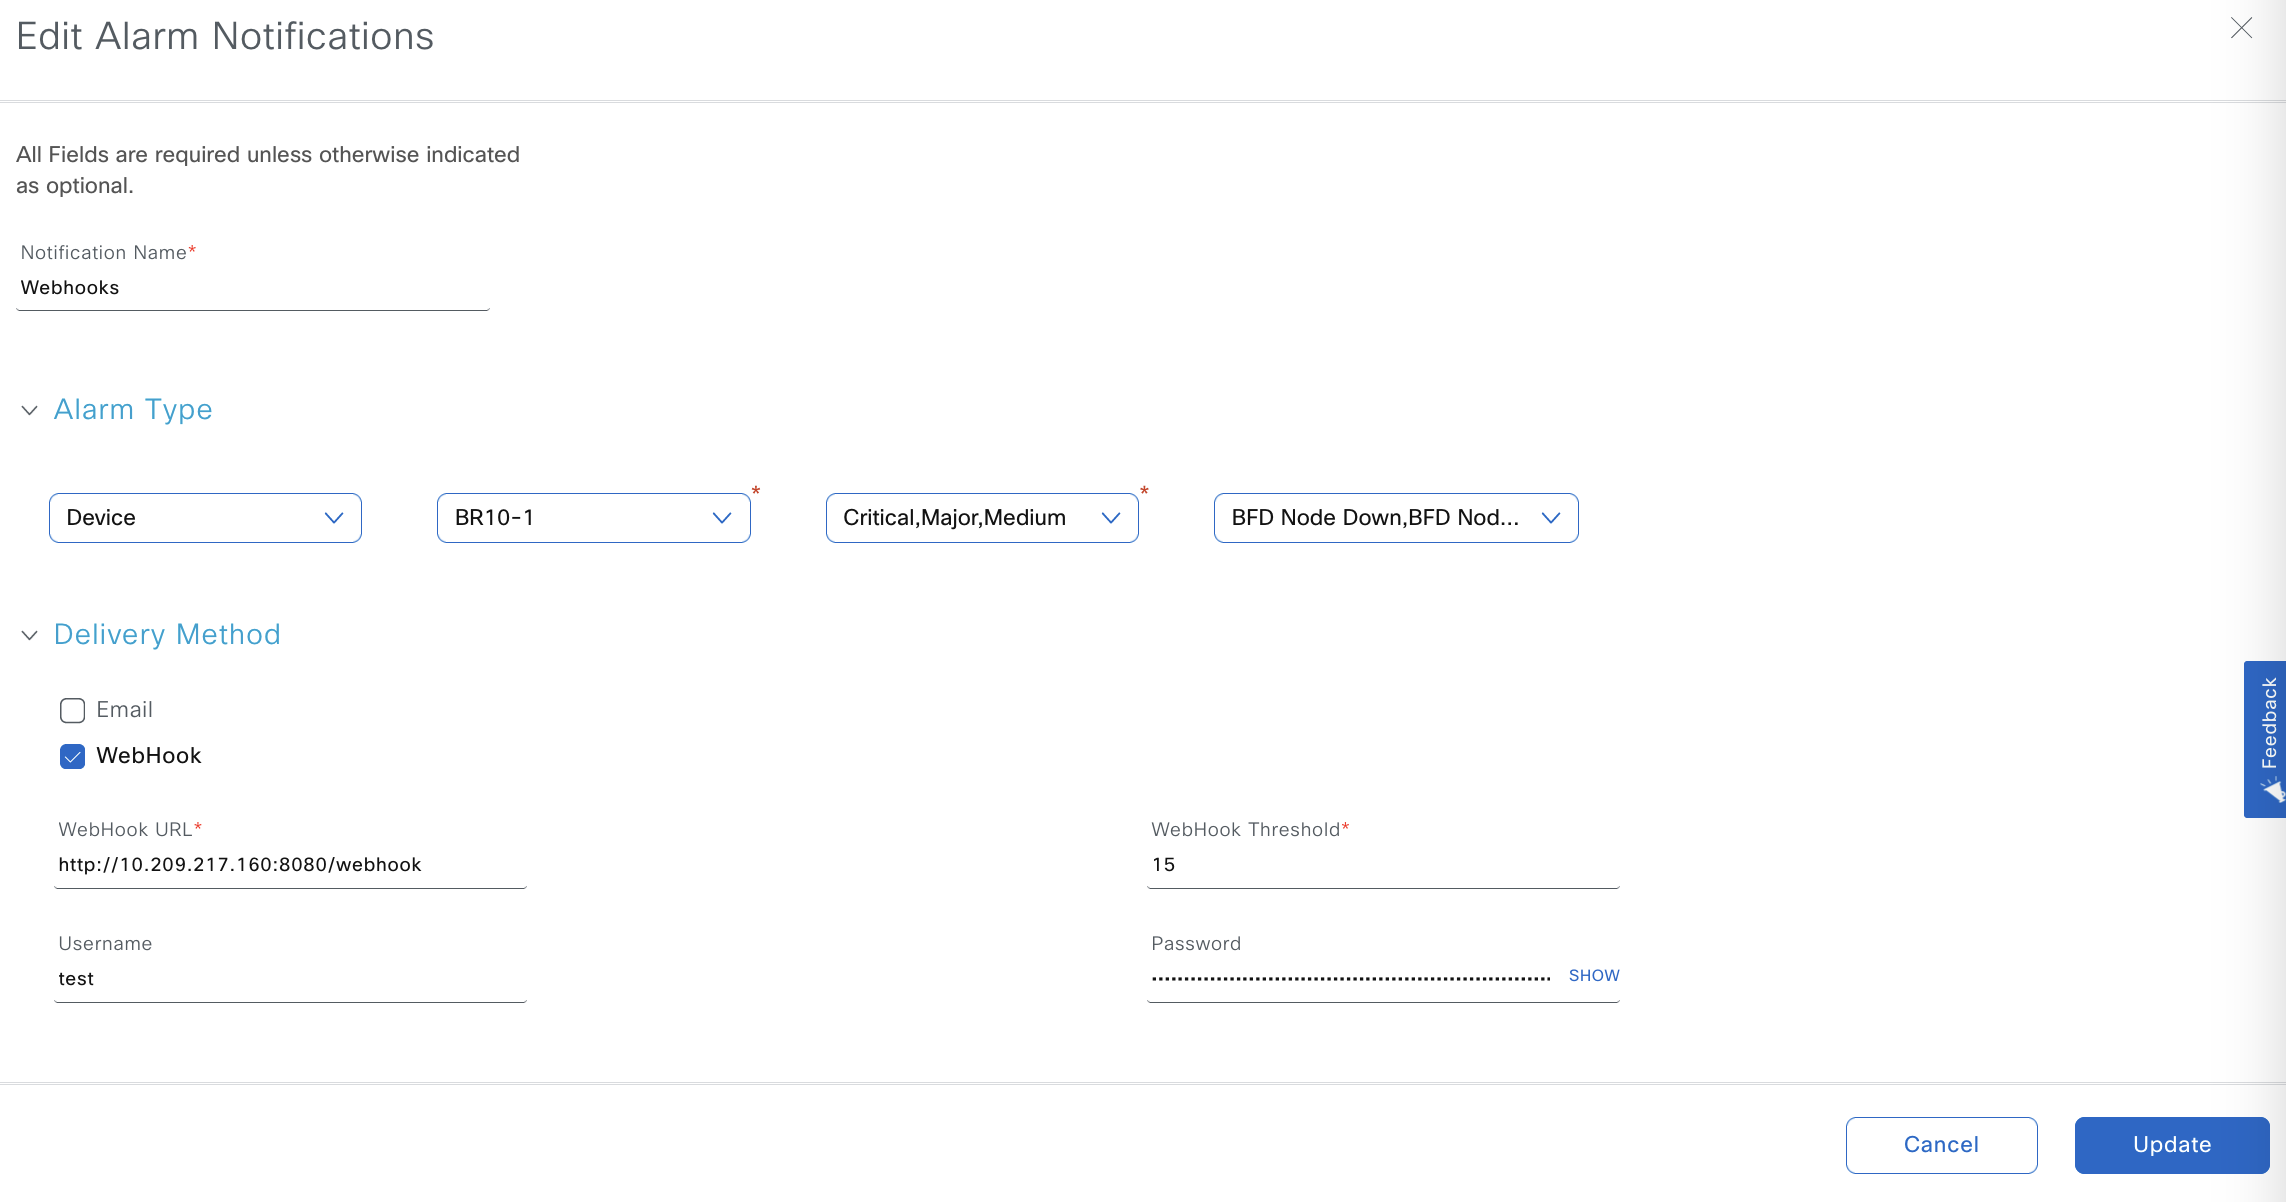
Things to know:
- You can chose to monitor site or devices.
- Severity is crucial. To open incidents, you typically want to monitor critical and high severity incidents, to close them you need to monitor lower severities.
- The alarms you want to generate webhooks for, in our case
- BFD node down/up
- Omp node down/up
- Control node down/up
- Interface down/up
- Notice that I am only using HTTP in my webhook URL, it is recommended to use HTTPS for higher security. The
8080:/webhookcomes from the app we build. - Threshold will limit the amount of notifications sent per minute to this URL. 15 is enough for me, but probably not for a production environment
- Lastly, user and password in case your webhook app requires it. These values would be encoded and sent on the headers. Use dummy values if not required.
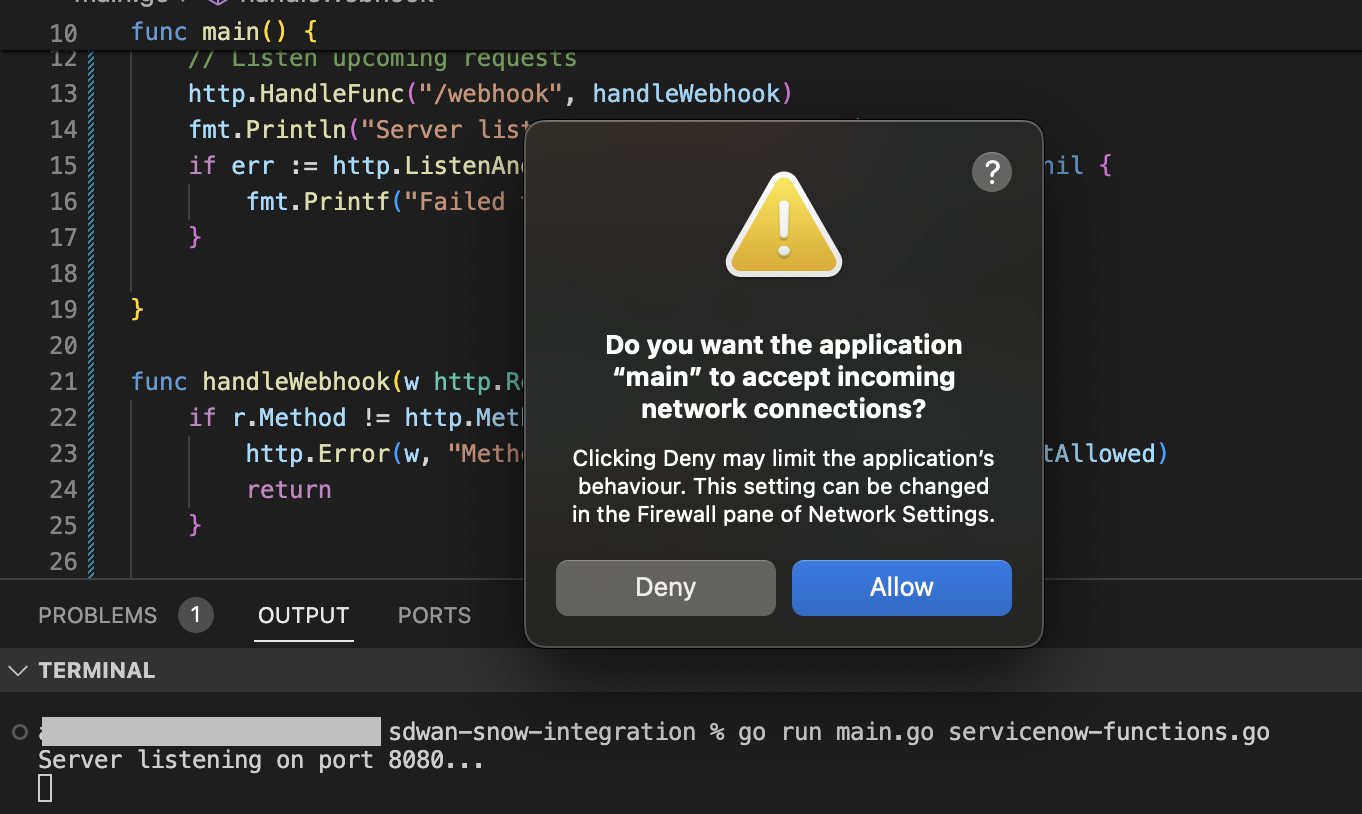
Build the Webhook Server
I have posted the code I used on the following GitHub Repo, here I will explain it in a simpler way.
Step 1: Listen requests coming on port 8080 and destined to /webhook endpoint.
// Listen upcoming requests

http.HandleFunc("/webhook", handleWebhook)
fmt.Println("Server listening on port 8080...")
if err := http.ListenAndServe("0.0.0.0:8080", nil); err != nil {
		fmt.Printf("Failed to start server: %v", err)
}
Step 2. Check if the incoming request has an active status. If yes, create an incident on Service Now.
//Verify if issue is active and create incident

if data["active"] == true {
	fmt.Println("Opening Service Now incident...")
	err := createIncident(data)
Step 2.1 To open an incident with Service Now, we need to reformat the information that will be sent there.
func createIncident(data map[string]interface{}) error {

        // Retrieve information to open incident
	issueId := data["uuid"].(string)
	ruleName := data["rule_name_display"].(string)
	title := data["message"].(string)
	severity := data["severity_number"].(float64)
	severityStr := strconv.FormatFloat(severity, 'f', -1, 64)
	device := ". Device " + data["host_name"].(string) +
		", System-ip " + data["system_ip"].(string)

	// Construct JSON payload for creating incident in SNOW
	incidentData := map[string]interface{}{
		"category":          "network",
		"caller_id":         "vManage",
		"short_description": issueId,
		"description":       ruleName + " - " + title + device,
		"urgency":           severityStr,
		"impact":            severityStr,
	}
...
Notice that we have stored the uuid coming from vmanage and used it as short_description for Service Now.
Step 3.a If the status is not active, we check if there are any cleared_events included, this will give us high precision when closing incidents.
if _, ok := data["cleared_events"]; ok {
...
	clearedEvents, ok := data["cleared_events"].([]interface{})
        eventId := clearedEvents[0].(string)
        incidentExists, incident_id, err := getIncidentWithId(eventId)
        ...
        if incidentExists {
		err := closeIncident(incident_id)
To close a case, we need to have the Service Now identifier called sys_id. To get it, we use the getIncidentWithId function.
func getIncidentWithId(issueId string) (bool, string, error) {
...
        // Store Service Now "short_description"
        shortDescription, ok := incidentMap["short_description"].(string)

        // Compare the short_description with the issueId
	if strings.Contains(shortDescription, issueId) {
	        // If the short_description matches the issueId, return the incident id
		sys_id, ok := incidentMap["sys_id"].(string)
			if !ok {
				continue
			}
	return true, sys_id, nil
Step 3.b If the status is not active and there are no cleared events included, we are going to try and find the incident that was opened. There are three things we check:
- Rule Name - The rule names for the events we are monitoring will have the following structure
_node_ . For example, BFD_Node_Down. If we are looking at BFD_Node_Up, we will change Up for Down and look for BFD_Node_Down on the incidents returned from Service Now. - System Ip - Store the
System-ipcontained on the notification and match it on the description of each incident returned. - Time - We store the
opened_attime and check if it less than 12 hours. This is a totally subjective measure, but my idea is that that issues that take longer than 12 hours to resolve, would have to be verified by some human.
func getIncidentWoutId(ruleName, sysIp string, openTime float64) (bool, string, error) {
...
      // IncidentMap holds the incidents from Service Now
      description := incidentMap["description"].(string)
      snowTime := incidentMap["opened_at"].(string)
      newRuleName := strings.Replace(ruleName, "Up", "Down", -1)

      // Compare Rule Name, system ip and time
      if strings.Contains(description, newRuleName) &&
	      strings.Contains(description, sysIp) &&
	      diffHours < 12 {
	      sys_id, ok := incidentMap["sys_id"].(string)
              sys_id, ok := incidentMap["sys_id"].(string)

              if !ok {
	              continue
	      }
	      return true, sys_id, nil
Step 4. Close the case with the sys_id obtained through getIncidentWoutId function.
if incidentExists {
	err := closeIncident(incident_id)
	if err != nil {
		fmt.Printf("Error closing incident: %v\n", err)
		// Handle the error accordingly (e.g., log it, return, etc.)
		return
	}
} else {
	fmt.Printf("Incident doesn't exist or is older than 12 hours")
}
Demo
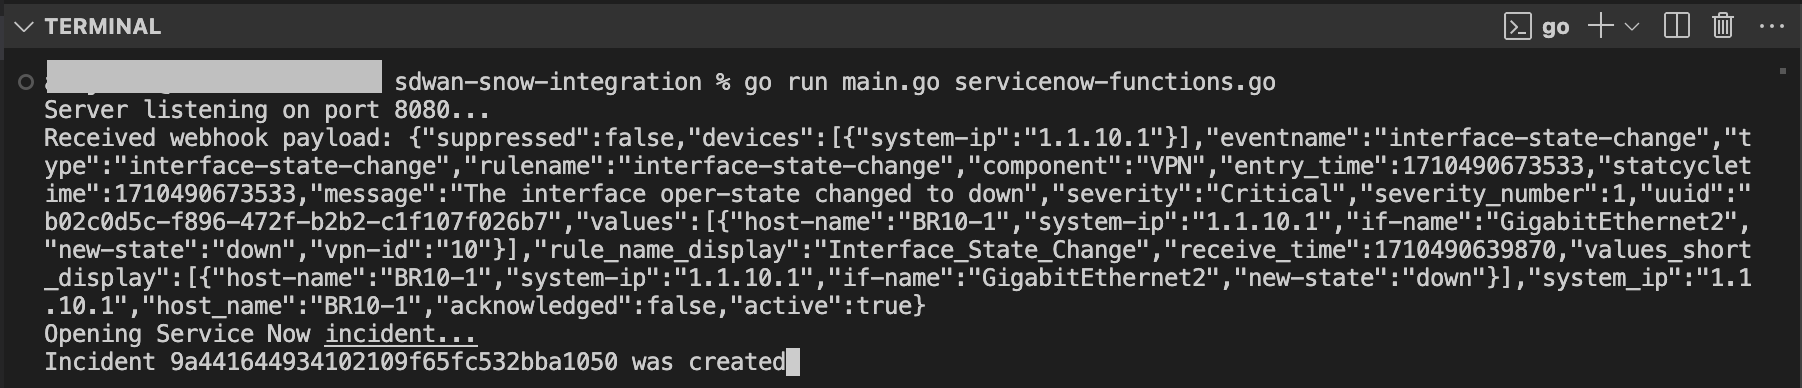
We’ll start by running the Go app. Notice I am not using VS Code to run it(Cntrl + F5), but the terminal so we can allow incoming connections.
Interface Notification
Let’s shut down one of the service side interfaces on the router:
BR10-1#config-transaction
BR10-1(config)# interface GigabitEthernet 2
BR10-1(config-if)# shutdown
BR10-1(config-if)# commit
Commit complete.
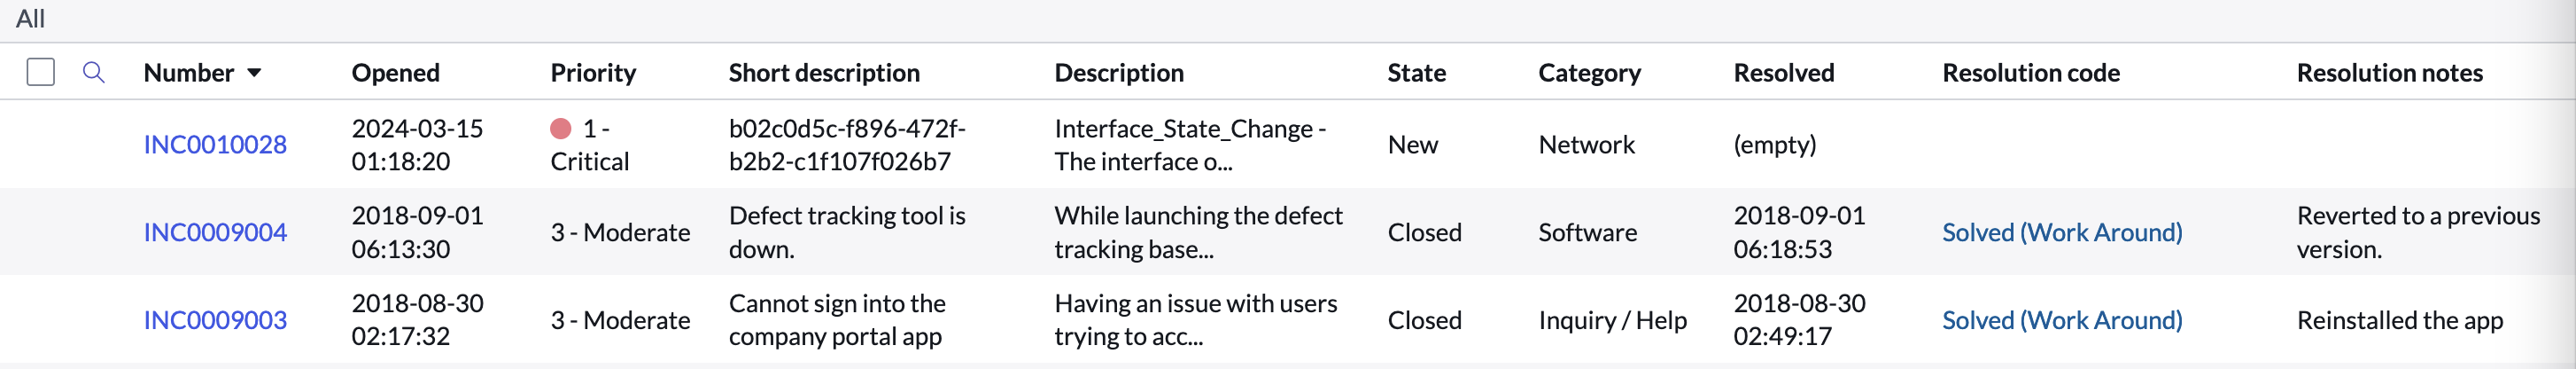
The server receives the notification and opens the incident. The incident number is the identifier in Service Now (sys_id)
We unshut the interface and the incident is closed
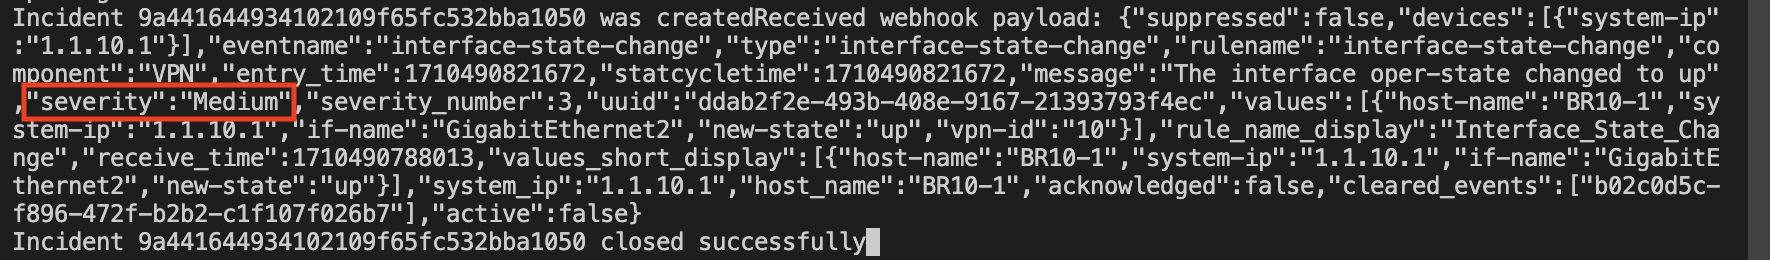
Notice this notification has the cleared_events information, so its very easy to find that incident in Service Now. Also, the severity is medium, that’s why it’s important to set the right value on the Alarm Notification configuration.
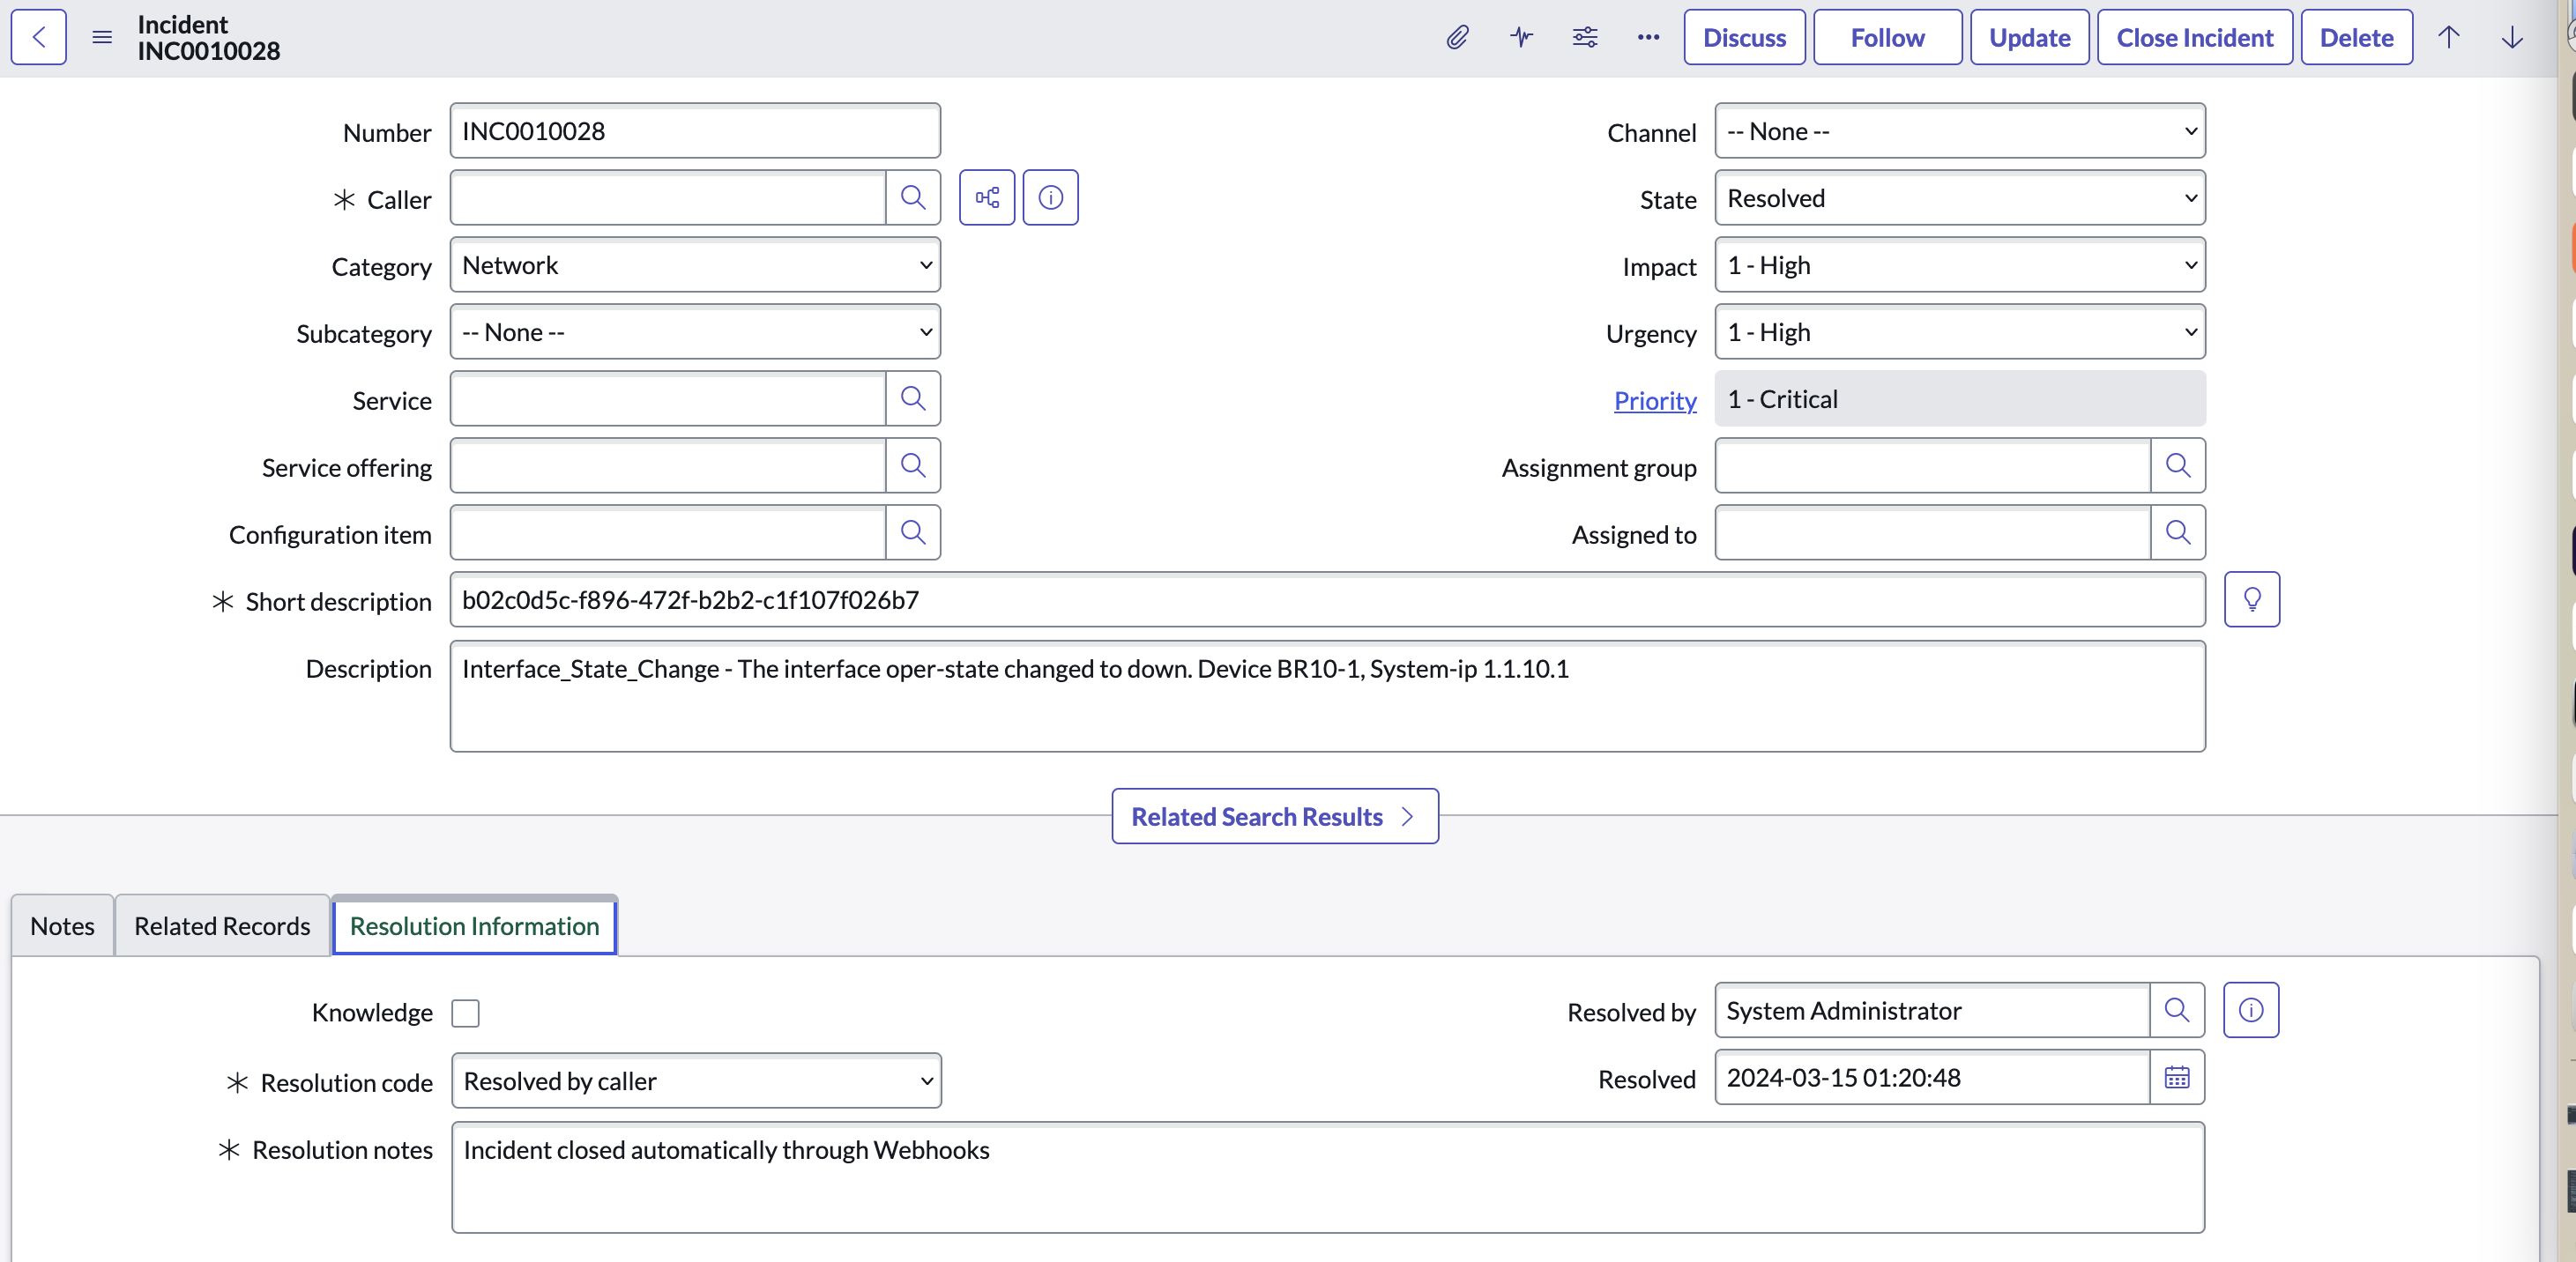
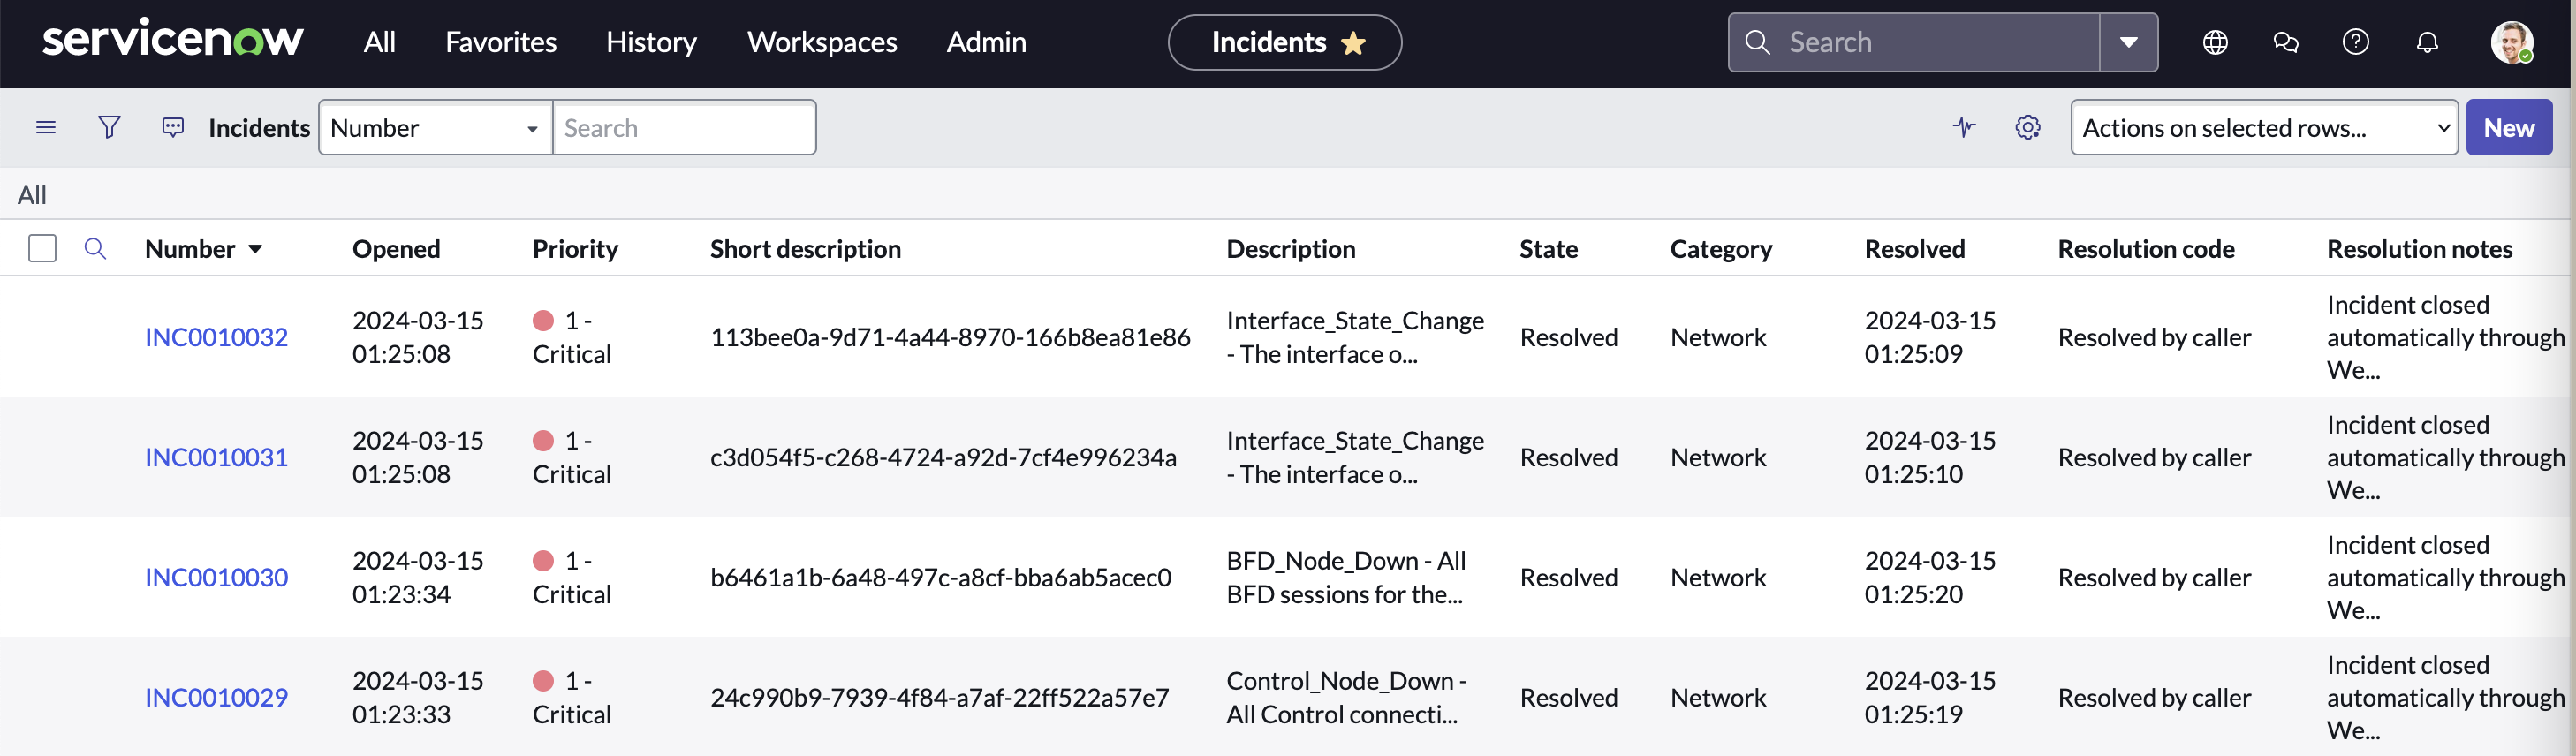
Notice that State is Resolved and Resolution Notes indicate the incident was automatically closed through Webhooks.
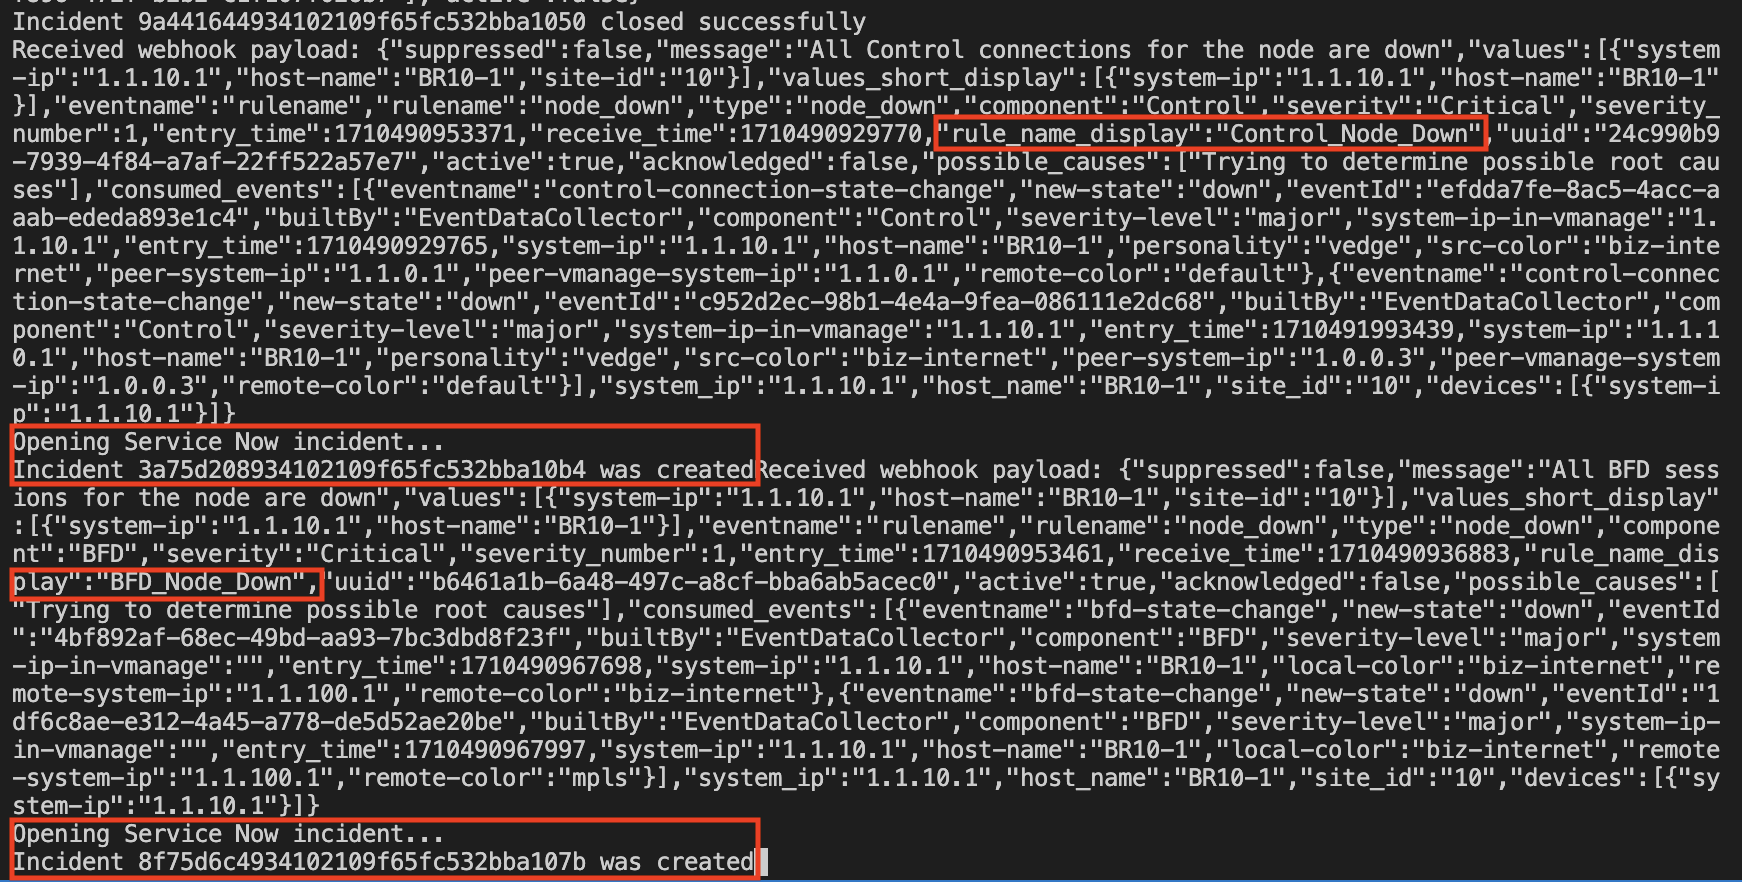
Control Connections and BFD Notifications
Let’s bring down CCs and BFD sessions by shutting down the transport interface
BR10-1(config)# interface GigabitEthernet 1
BR10-1(config-if)# sh
BR10-1(config-if)# commit
Commit complete.
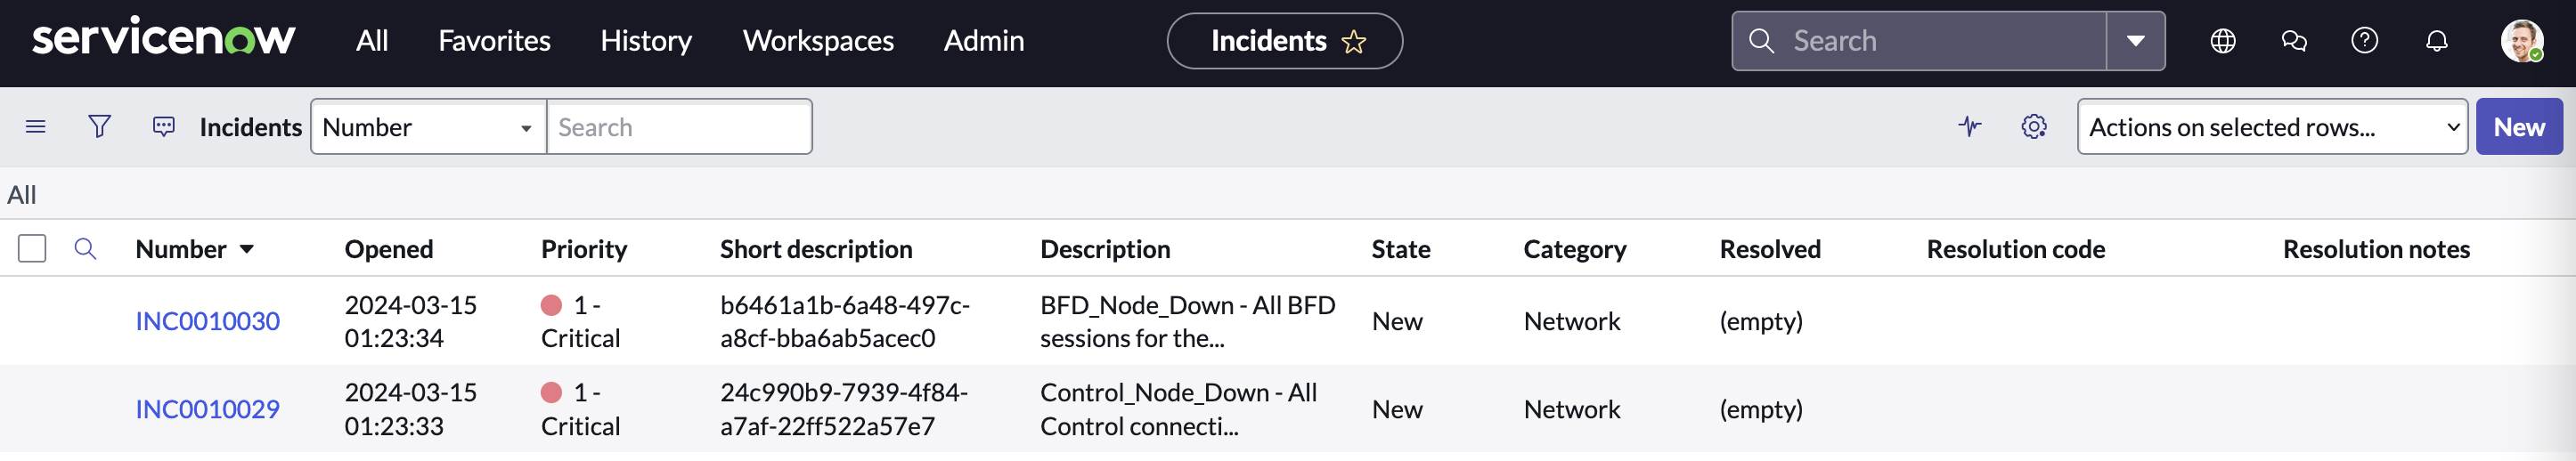
Notifications were received and incidents were created
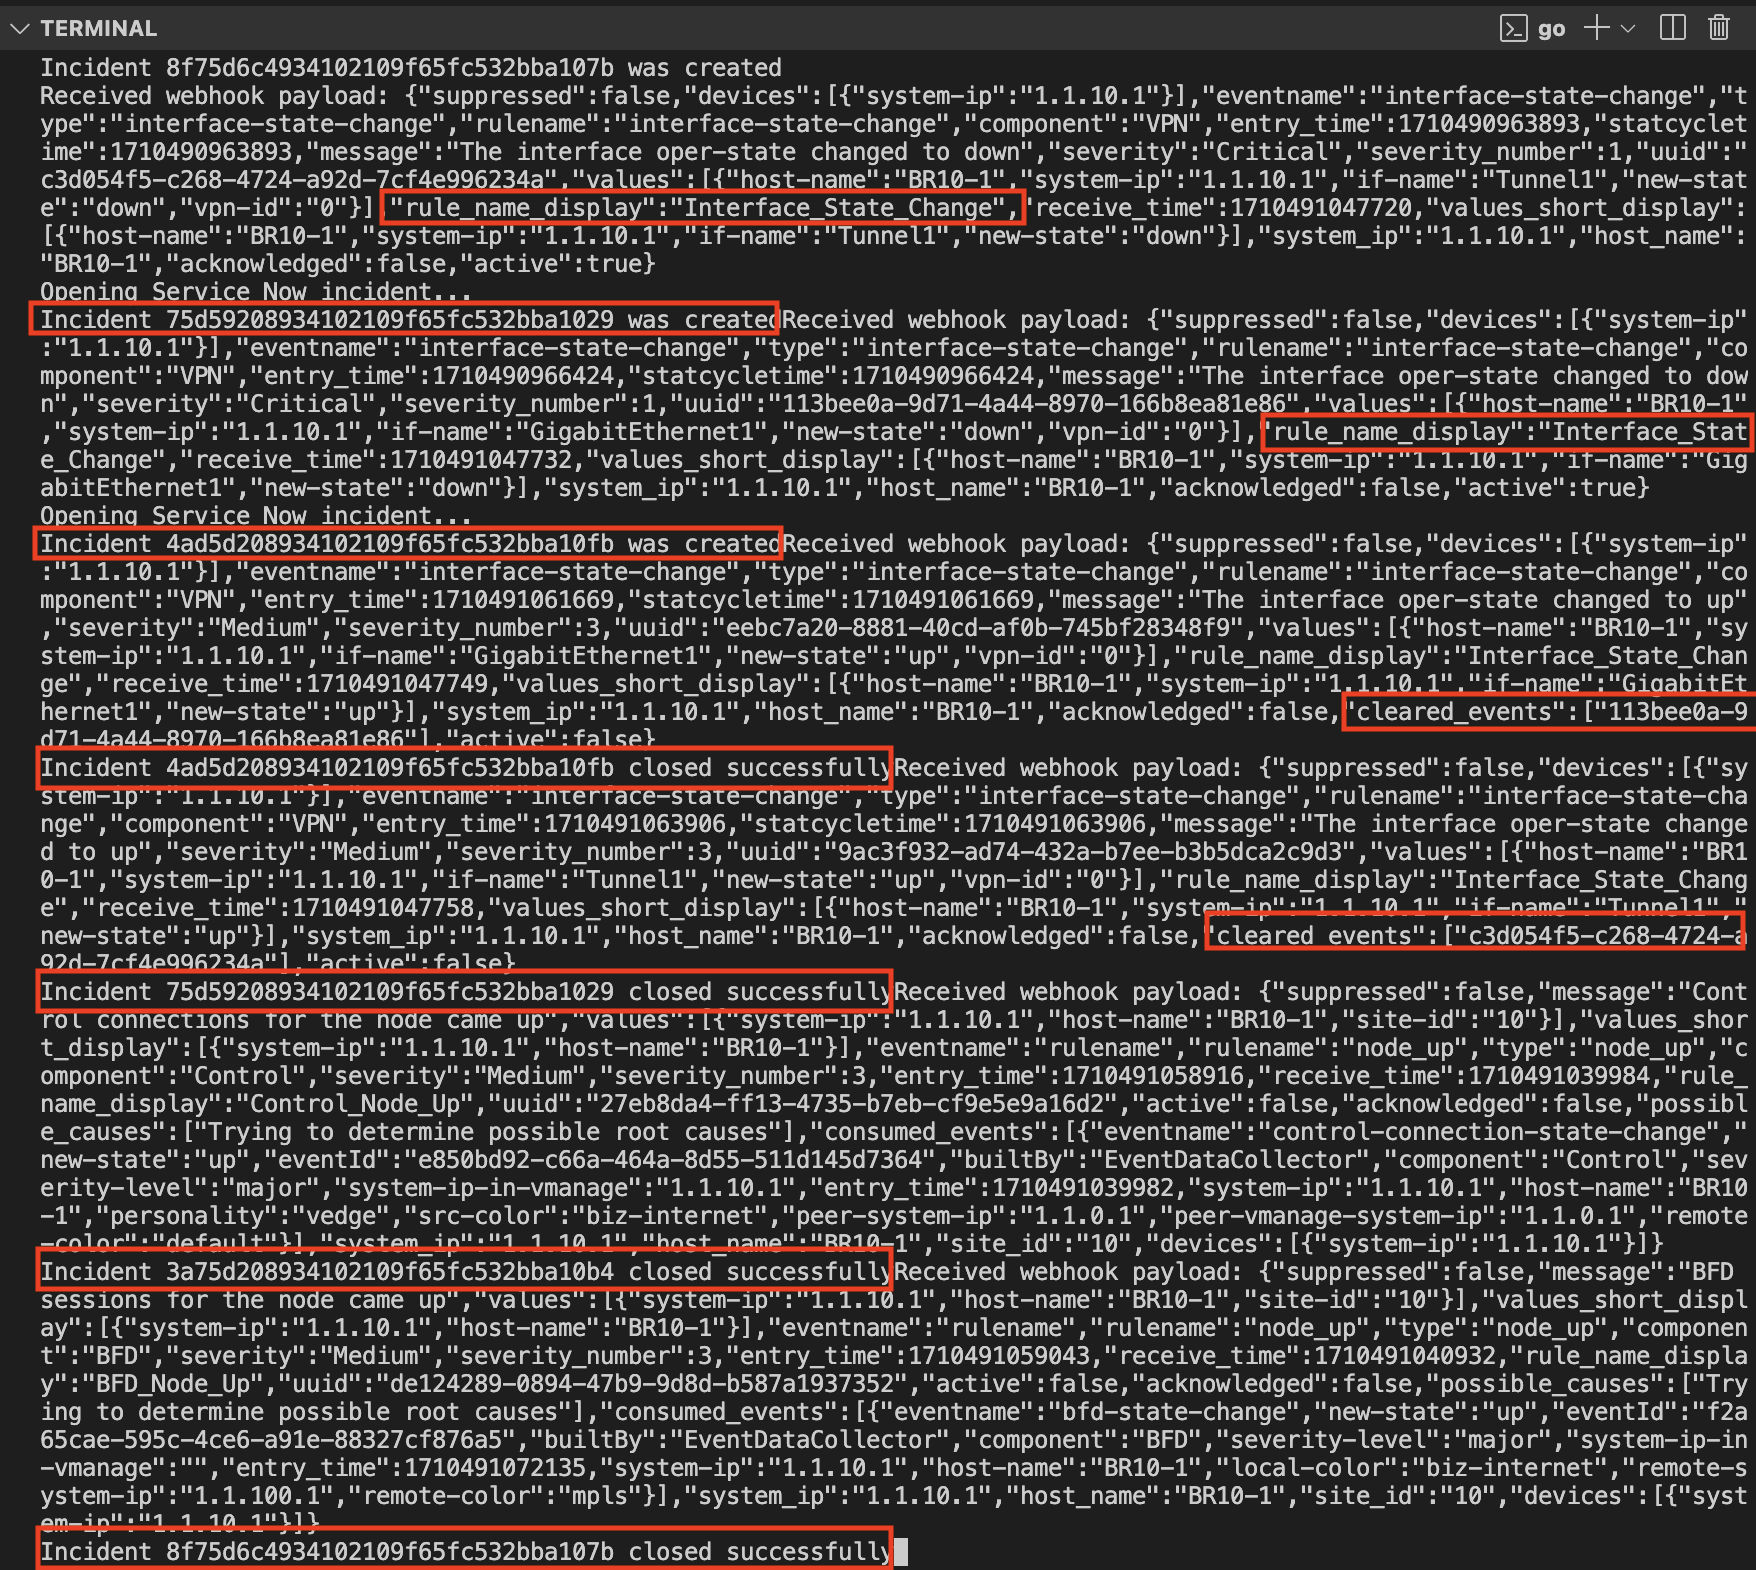
When we un-shut the interface we receive the notifications and also, we log the interface state status for interface Gig 1 and Tunnel1. This is all reflected in Service Now. These interface notifications were not delivered before because connectivity with SD-WAN Manager was lost.
Lessons Learned
- It’s very important to monitor the right severity level, otherwise we might miss notifications to properly close the incidents.
- SD-WAN Manager could be a bit chatty when generating alerts, the webhook threshold becomes very important and you should test to come with a number that works for your environment.
- Service Now will come up with a priority based on the Urgency and Impact used to create the ticket.
- Service Now could have some policies that will prevent you to close incidents if certain information is not present on the UI. Be a little bit familiar with UI policies and Data Policies.
- Although you can manually set the “sys_id” on Service Now through APIs, I suggest to leave it alone as putting manual values could cause problems in the future and this field is supposed to be unique across your instance. Just use the auto-generated value.
- You can use public sites like this one, to easily see the content of the notifications while planning your use cases.
Conclusion
Los webhooks son una excelente manera de monitorear nuestro entorno. Ser notificados exactamente cuando ocurre un problema, en lugar de depender de monitoreo continuo, aumenta nuestra capacidad para registrar y reaccionar rápidamente ante lo que está sucediendo. Puedes combinar los webhooks con otros tipos de alertas, como correos electrónicos o incluso chat (Webex, Slack, etc.) en caso de que necesites alertar a diferentes equipos. Espero que este post te haya dado algunas ideas o haya despertado tu curiosidad.
¡Gracias por leerlo!