Motivation: The typical crisis scenario
Imagine starting your day in the networking team, only to be bombarded with complaints about the main internal application being down. You start investigating. Where is the problem located? Is it isolated or affecting multiple places? When did the problem start? What is the impact?
Next, you get someone to help you verify the basics. DHCP and DNS work. Gateway is reachable. Connectivity to other targets on the same DC is intermittent! It is starting to get weird…
At this point, every minute counts and a proper troubleshooting process needs to be implemented to check all the devices involved and isolate the root of the problem. You start taking packet captures and traces on different points of the network, you check counters, bfd and ipsec sessions, look for inconsistencies on the omp/routing table, verify lengthy policy configurations and port parameters, one hop at a time. Two hours later (hopefully!) you and your team finally get to the root cause…
What Cisco did about it?
Having in mind the level of complexity and the efforts needed to resolve network issues, Cisco created Network Wide Path Insights to make our WAN troubleshooting substantially easier. NWPI was first introduced in 20.4 and with every release it kept getting better. Fast forward to 20.9 and you have much better usability and insights that will help you quickly determine what is going on. Want to see it in action? Tag along!
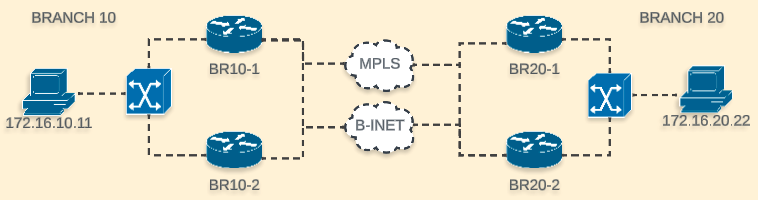
Topology
We will use this scenario to run our NWPI trace. There is no centralized policy in place, as a result we have a full mesh and traffic could flow on any of the available tunnels.
Understanding NWPI
On vManage, navigate to the Tools section to find this feature. To start using it, the minimum information you need is:
- Where traffic is generated (
siteID) - Segment of the network (
vpn)
Device is auto-populated. You can further refine your filters to capture exactly what you are looking for.
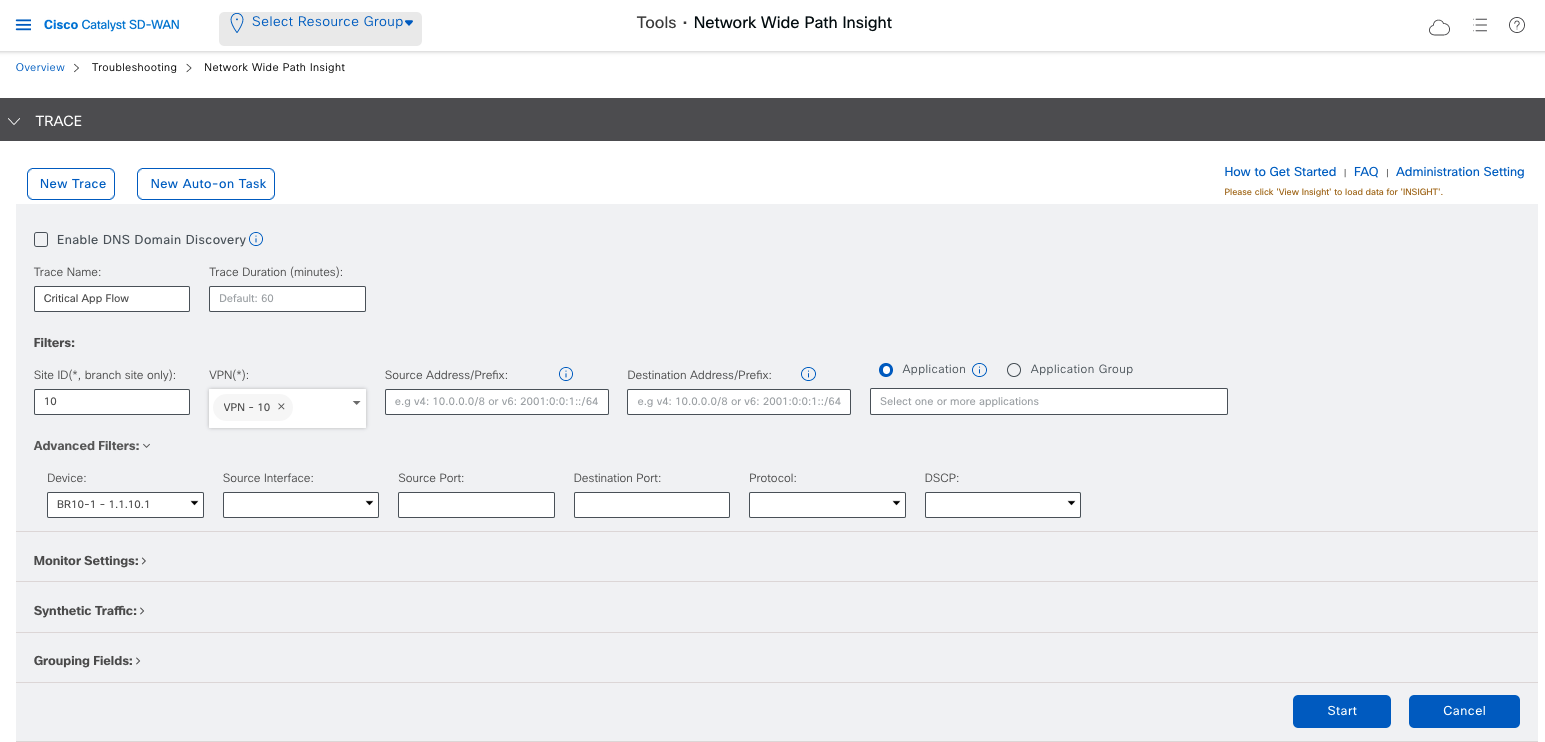 20.12.2 NWPI
Once your filters are in place, start the trace and see the magic.
Insight - basic view
Let’s see the results of a small scp transfer from branch 10 to 20. This is the first piece of information we will see. Click the image to expand.
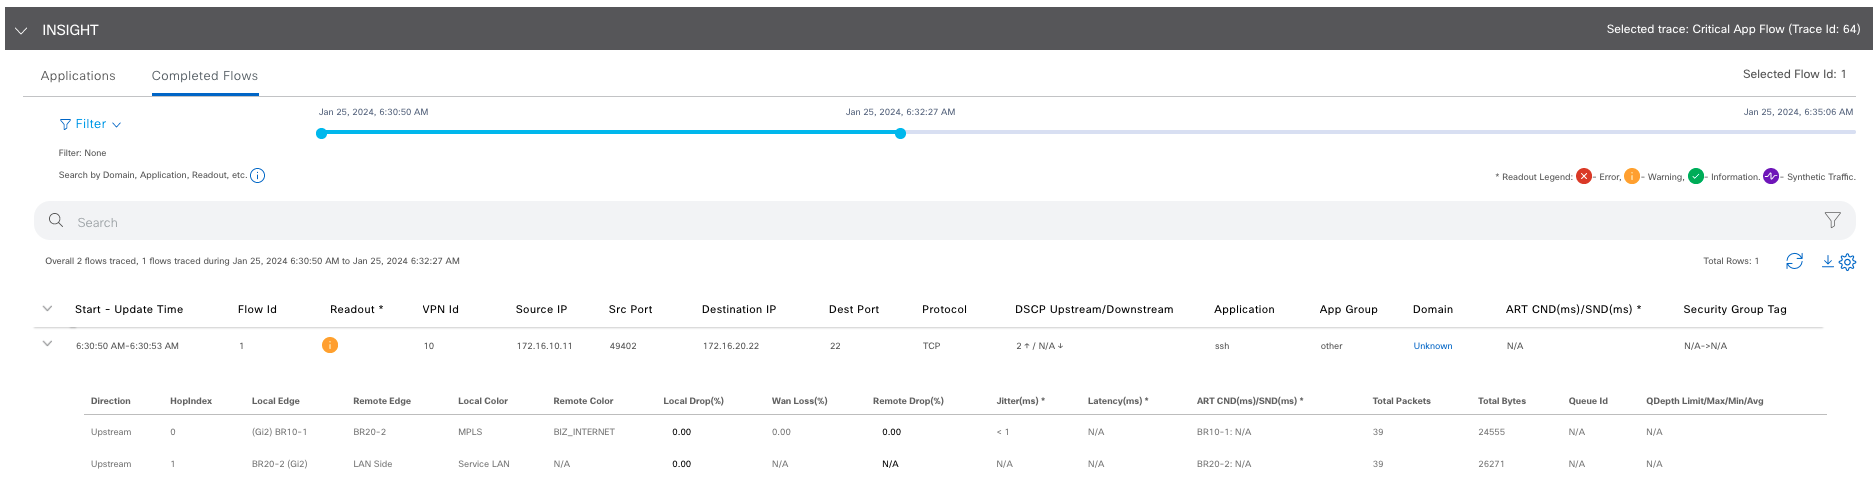
From the above, we can determine:
- Flow direction - Traffic flowing from branch 10 to 20
- WAN edges touching the traffic - BR10-1 and BR20-2
- Flow information - Src/Dst IPs, ports, protocol, App, etc.
- Colors involved - MPLS -> Biz- Internet
- SD-WAN KPIs specific to the flow- Loss, latency and jitter
- Drop percentage - On the WAN and on devices
Let’s click on the readout to learn more
Readout
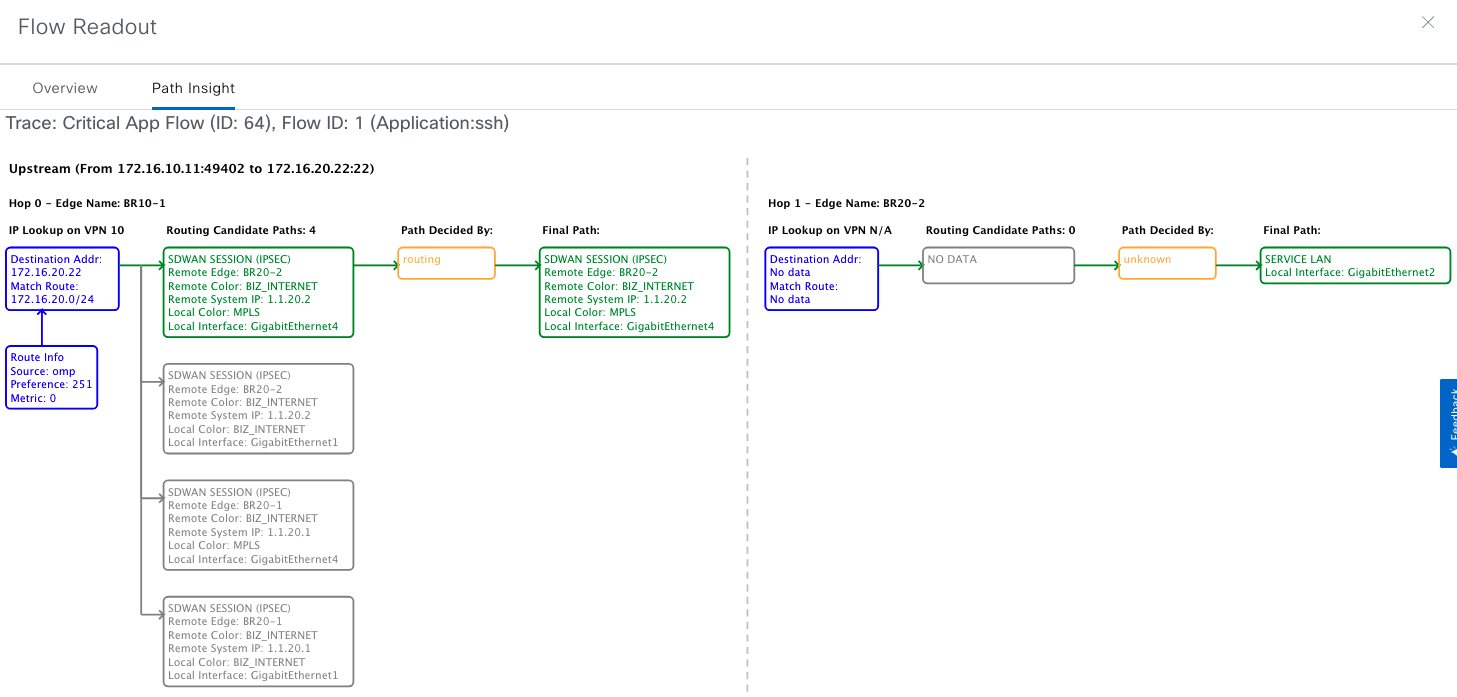
New information is available to us:
- Matching entry on routing table - 172.10.20.0/24 coming from OMP and its respective metrics.
- Candidate and chosen path - Available paths shown and chosen one highlighted in green.
- Physical interfaces involved - Both for service and transport side
- Reason to choose this path - Routing, however keep in mind policies can override the routing table.
If we stop here, we already have a lot of very useful information to understand the flow of the traffic, but what if we need to dig deeper? Well, let’s now explore the Advanced Views
Advanced Views
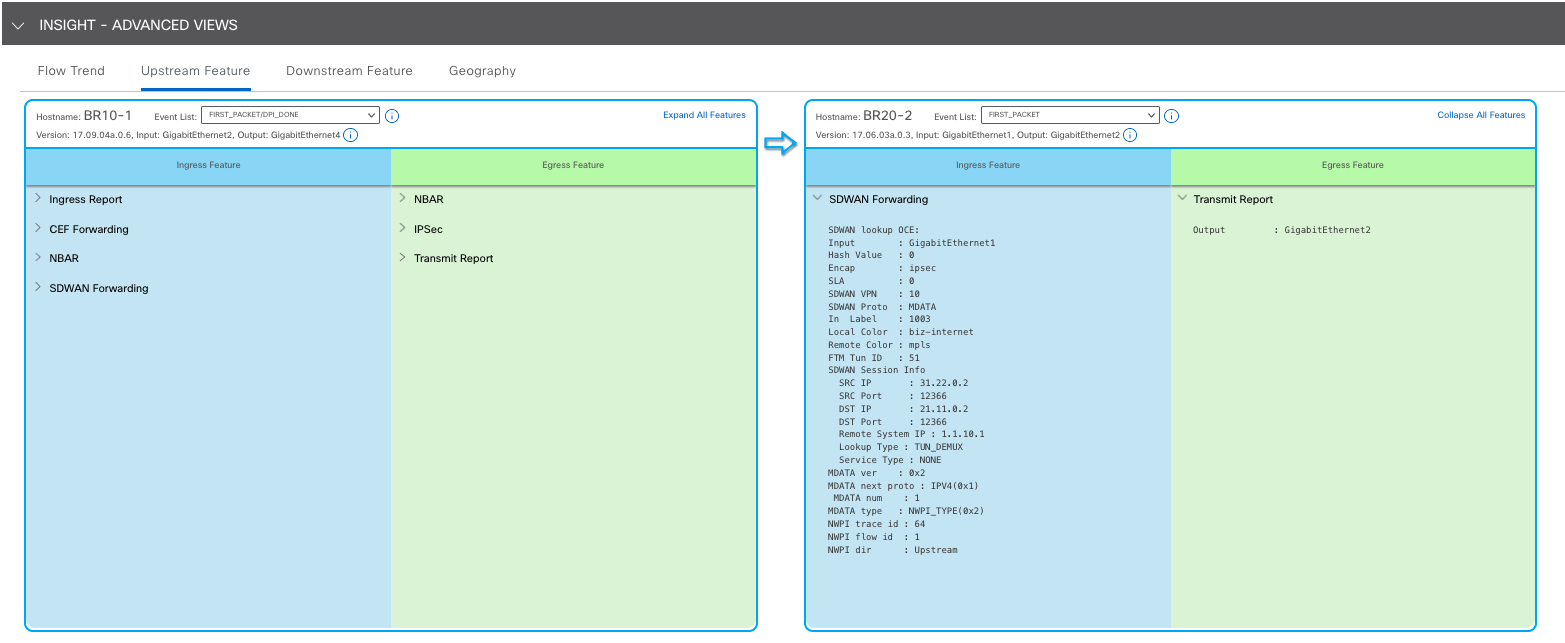
If you know the Datapath Packet Trace, this information will look familiar. Essentially, it will tell us all the features that are executed by the device as the packet is being processed. Some examples could be ACLs, Policies, FW rules, DPI, Netflow and much more. There are instances where we need to determine if/why the device is dropping packets, this is the place to check!
In summary here is the additional information we can get:
- Features - Some of them will be configuration dependent, some will always be there on an SD-WAN environment.
- Drops - If a feature is dropping traffic, you have the information to know exactly why.
- Low level details around the features - Most of the time you won’t have to deal with this, but may be useful when you contact technical support.
There is much more to this feature, but I think this is enough as an introduction. Before going to the conclusion, though, I would like to mention some of the use cases where this feature will come in handy.
- Poor application performance
- Policy validation
- Problem isolation
- DIA and SaaS validation/troubleshooting (yes, it can also give information of traffic destined to the internet)
What other scenarios could you think about?
Conclusion
NWPI is a great example of Cisco’s effort around serviceability - creating a tool that can help troubleshoot and resolve issues faster in a simple and efficient way. Check this guide to know more about it and be aware of the features introduced on the newest releases and more. In my experience, NWPI is not used enough mainly because it’s still unknown for a lot of customers and partners. I would encourage you to try it out and eventually incorporate it to your troubleshooting tool set, I am sure you will find some benefit to it.