Introduction
It has been a while since I wanted to hop on to the LLM train and learn how to use one of the popular frameworks. A few months back, I saw a great Cisco Live presentation by my good friend Jesus, and it gave me the determination I needed to finally dive deeper into the topic.
Since then, I have been doing research and thinking about a nice use case for me to put as objective of my learning process. After considering different options, I decided to build an SD-WAN AI assistant that could help me troubleshoot an SD-WAN issue. Taking advantage of the available tools, I decided that my assistant would be an expert on the Net work Wide Path Insights functionality.
In this post, I want to share a bit of my experience building it and of course show some of the results. For a better understanding I suggest to have the G ithub repo opened as you go through the post.
About the setup
My SD-WAN Lab is running 20.12.3 on the Manager and the Wan Edges are using 17.9.4a. I have a very simple topology that looks something like this:

The programming language used is Python and the framework I chose to interact with the LLM is LangChain. I used OpenAI model gpt-4o and a Webex bot for the interaction. The repo can be found here.
My objective
For the sake of context, troubleshooting inside a SD-WAN fabric is not easy because traffic is encrypted, policies dictate how traffic will flow, there could be multiple paths to a destination, next hops can be changed with policies, there are multiple hops involved, and more. Figuring out all this information is time consuming and not a straightforward process.
NWPI Trace is a tool that greatly improves the troubleshooting process as it will give hop-by-hop information and visibility. It can be easily started from the Manager’s UI, it will detect flows based on specified filters and you can browse around to get all the visibility you need. It is a very complex and complete tool. As I described before, I wanted to use this project as a playground to learn and since I didn’t have prior experience with LLMs or LangChain I set a simple objective:
Build an assistant that can start a NWPI trace and give me details of the flows.
Planning and Building
Ok, I had my objective, but how to start?
I took a hands-on approach which meant that I didn’t learn LangChain from scratch and instead took the Cisco Live session repo as a base and built on top of that. The reasons to choose this repo were simple:
- It was explained on the sessions so I had a general idea of the technologies and its purpose.
- I thought it would be easy to adjust to my use case (Eg. I also use Webex, I will be interacting with network devices, I saw how the tools could be replaced with my own)
I had to do some cleaning before starting, this required me to understand what was essential to host the LLM and interact with it. Luckily, the repo had an organized structure that made it easy to understand.
From the session, I learned about LangChain Tools, so I knew I could create functions that my agent could use to perform different actions. In this case, actions would be something like starting those traces and getting info from them
Challenge 1
I needed to get familiar with the NWPI API, at this point I knew I had seen somewhere on the API documentation that some operations were available, but never had taken the time to analyze them. To my surprise, the specific actions of starting a trace and getting details of it, were not included… There was information about starting a “task” a.k.a “Auto-on Task”, which is not the same as the “Trace” I had in mind. At this point, I needed to decide if I would go for the “official” and maybe easier way or exploring an alternative to achieve exactly what I wanted.
Knowing that almost everything is API driven, I used the inspect tab of my browser and started exploring the APIs triggered when I started a trace through the UI. After a first quick pass, I determined it was doable and started gathering the information I needed.
Challenge 2
I already knew I would have to do some analysis to make my idea a reality, but I underestimated how much I would need to do. In fact, the difficulty of this task kept me away from the project for some time as it became increasingly complex.
In my mind there were only 3 “simple” tasks:
- Find the API to start the trace
- Find the API to confirm the trace is running
- Find the API to give me details of the flows
Find the API to start the trace
Starting a trace from the UI is very simple, you just need a Site ID and a VPN ID. However, there are underlying verifications happening that we take for granted.
- The site ID is really needed to identify the devices to start the trace on.
- There are a bunch of options (QoS insights, ART visibility, APP visibility, DIA, etc) that are version dependent.
- The VPN needs to exist.
To get this done I created the function get_device_details_from_site so I could find related information of the devices to start the trace. I needed:
- versions
- serial numbers
- names
- reachability status.
Then, I created the start_trace function that would receive the information previously obtained and other filters. I kept the filters as simple as possible, leaving only an option to specify a source and destination subnet. There are a lot of trace options for which I didn’t do any type of version verification before running it, I just did it for the QoS insights that requires version 17.9 or later. This function returns some information needed later to verify the status.
Find the API to confirm the trace is running
This was probably the easiest task. I created the verify_trace_state function and with the help of the LLM it can be ran some seconds after starting the trace. It returns the state, which is also needed to get information later on.
Find the API to give me details of the flows
This was the most complex and time consuming task. In my mind checking the result of a trace is very simple, however when we receive the information in chunks, through different calls it starts getting tricky.
I tried to replicate the process I go through on the UI:
- View the insights of the trace and check the flows that were captured (if any)
- For the list of flows, look for the one that had the “readout” button in red (problem detected) and click to get more details.
- Expand the flow view to get access to the advanced functionalities so I can determine the features that the packet is going through on each of the hops.
To get the flows captured for the trace I created the function get_flow_summary. This function will return the list of captured flows, You will see details like src/dst, application and protocol. This is useful to identify the flow id that you are interested in getting more details.
I created the trace_readout function to get a summary of the events that the trace captured along with the affected path. For example, you could see that an SSH flow is not working between Device X and Device Y.
Ok, once you have identified the flow and events you are interested in, you can get detailed information of the flow with the function get_flow_detail. This will give you hop by hop information like:
- Hop
- Event
- Local/Remote colors
- Ingress/Egress interfaces
- Ingress/Egress features applied to packets
- Feature making the forward decision
With this information is possible to see all sort of things, like ACLs, type of policies applied, why a packet was routed through a specific color, drops, confirm your policy is working as expected, etc.
Ok, I think that’s it!
Demo
I started by creating an ACL to block communication and applied it on the DC side.
Munich_DC100-1 - ACL configuration

sdwan
 interface GigabitEthernet2
  access-list ACL_Drop_172_16_10_0 out

policy
 access-list ACL_Drop_172_16_10_0
  sequence 1
   match
    source-ip      172.16.10.0/24
    destination-ip 172.16.100.0/24
   !
   action drop
    count dropCounter
   !
  !
  default-action accept
 !
Will my assistant detect this? 🤔
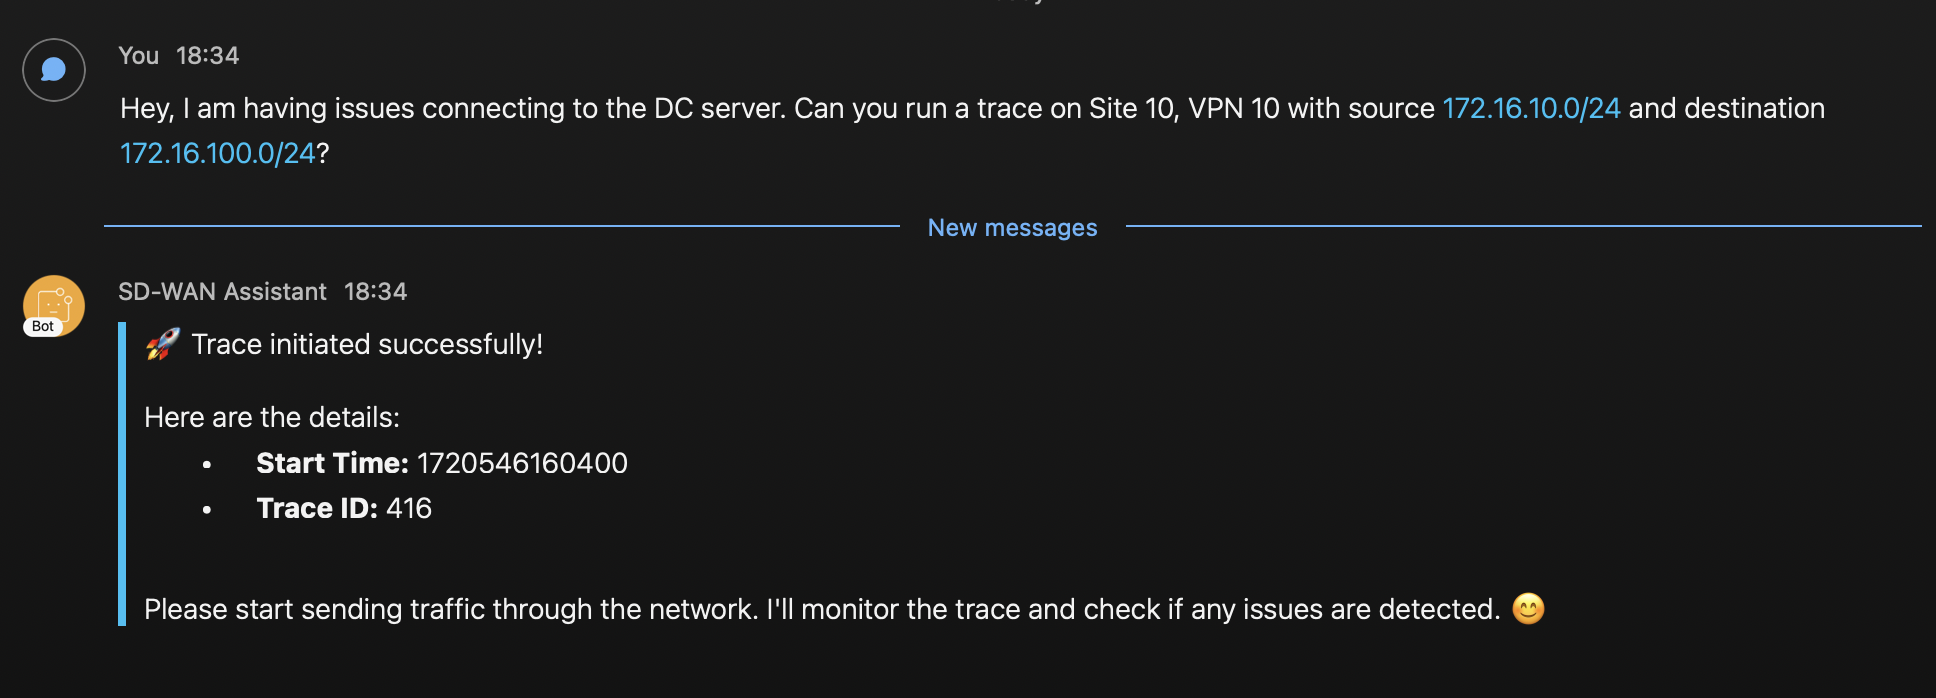
Next, I start the application and request the LLM to start a trace. I can confirm on the UI that it is created.


I start a couple of SSH connections from branch to DC

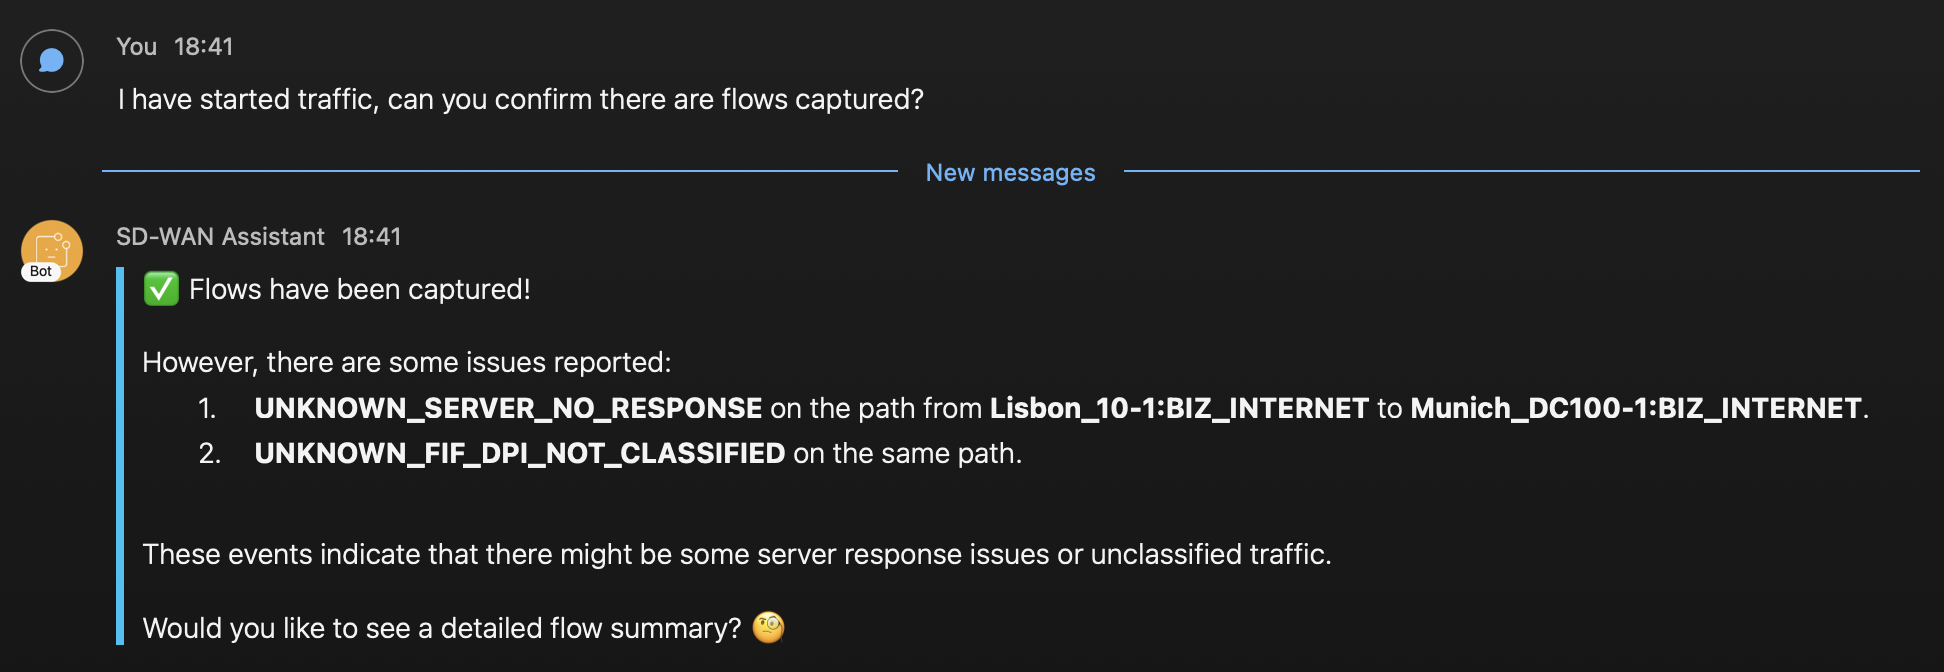
Then, I ask the assistant if flows have been captured, it responds with this

We can see flows were captured and also it gave me more information of the events detected and the path with device names. The first event seem to be related to our issue. So far the information looks accurate, let’s get more details.

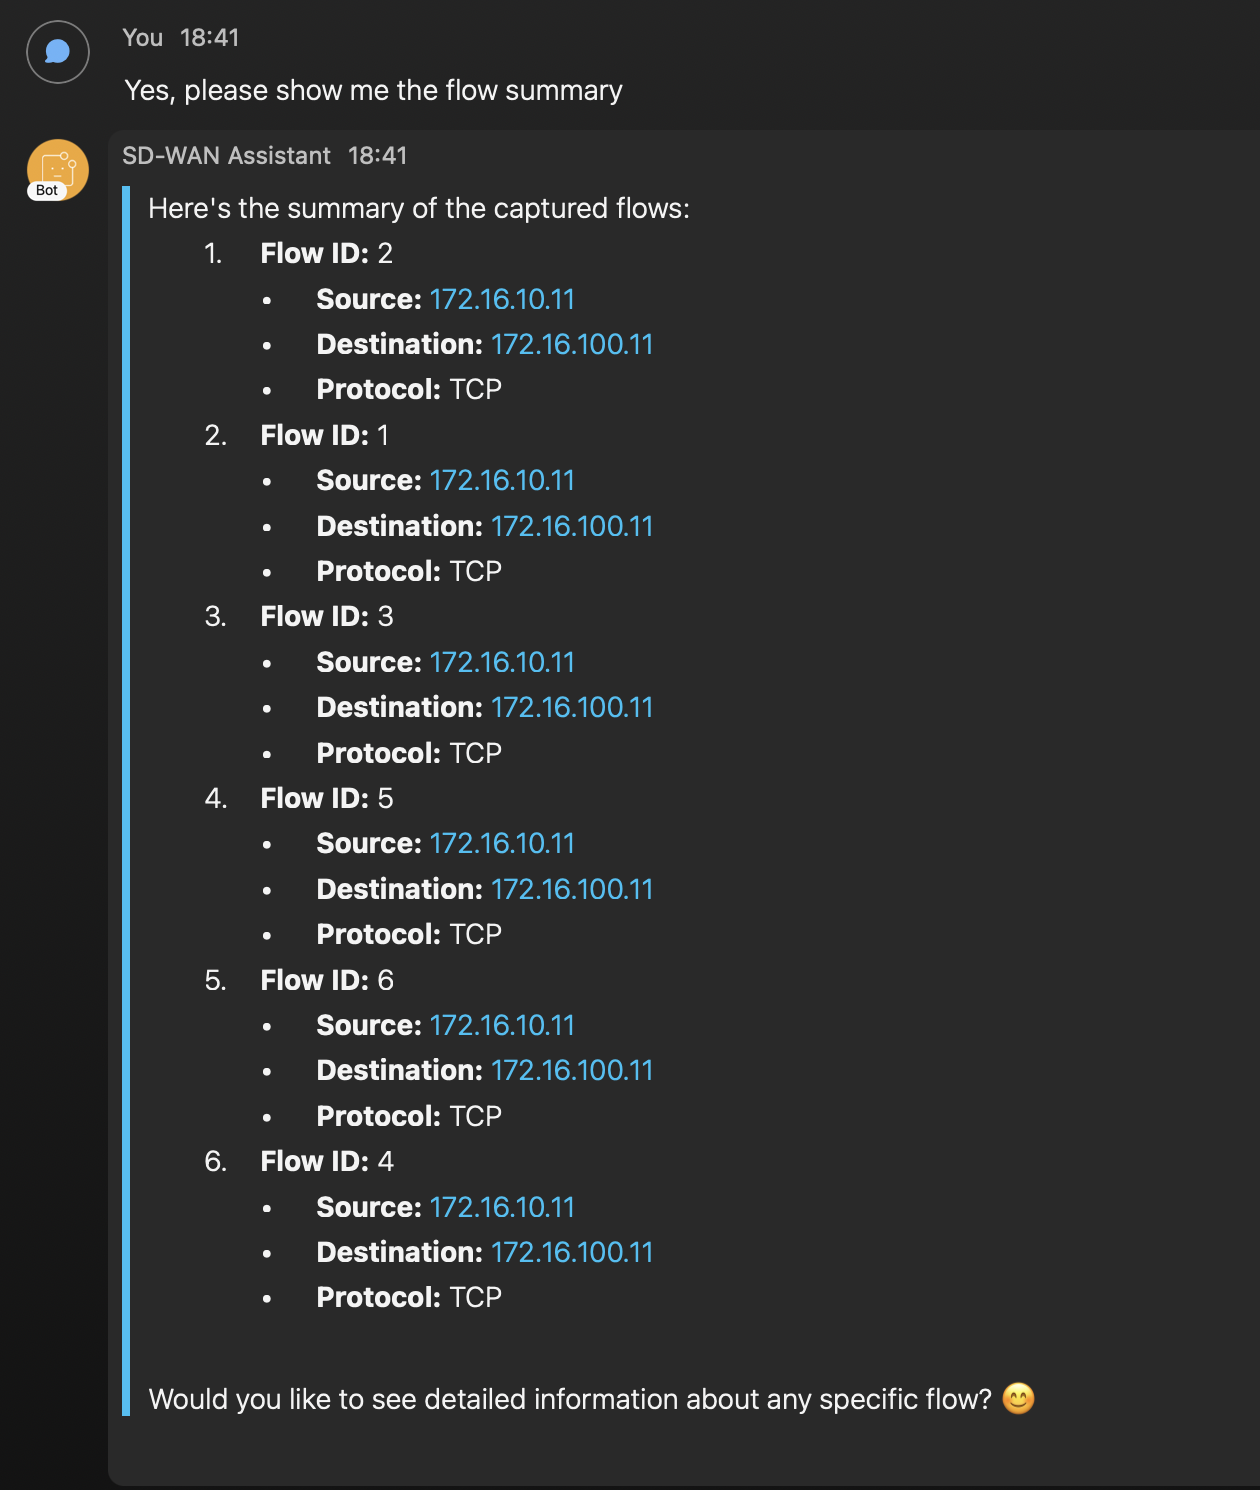
With this, we can see that the client sent multiple ssh attempts, we can dig further into one of the flows. Let’s see what else it gives.

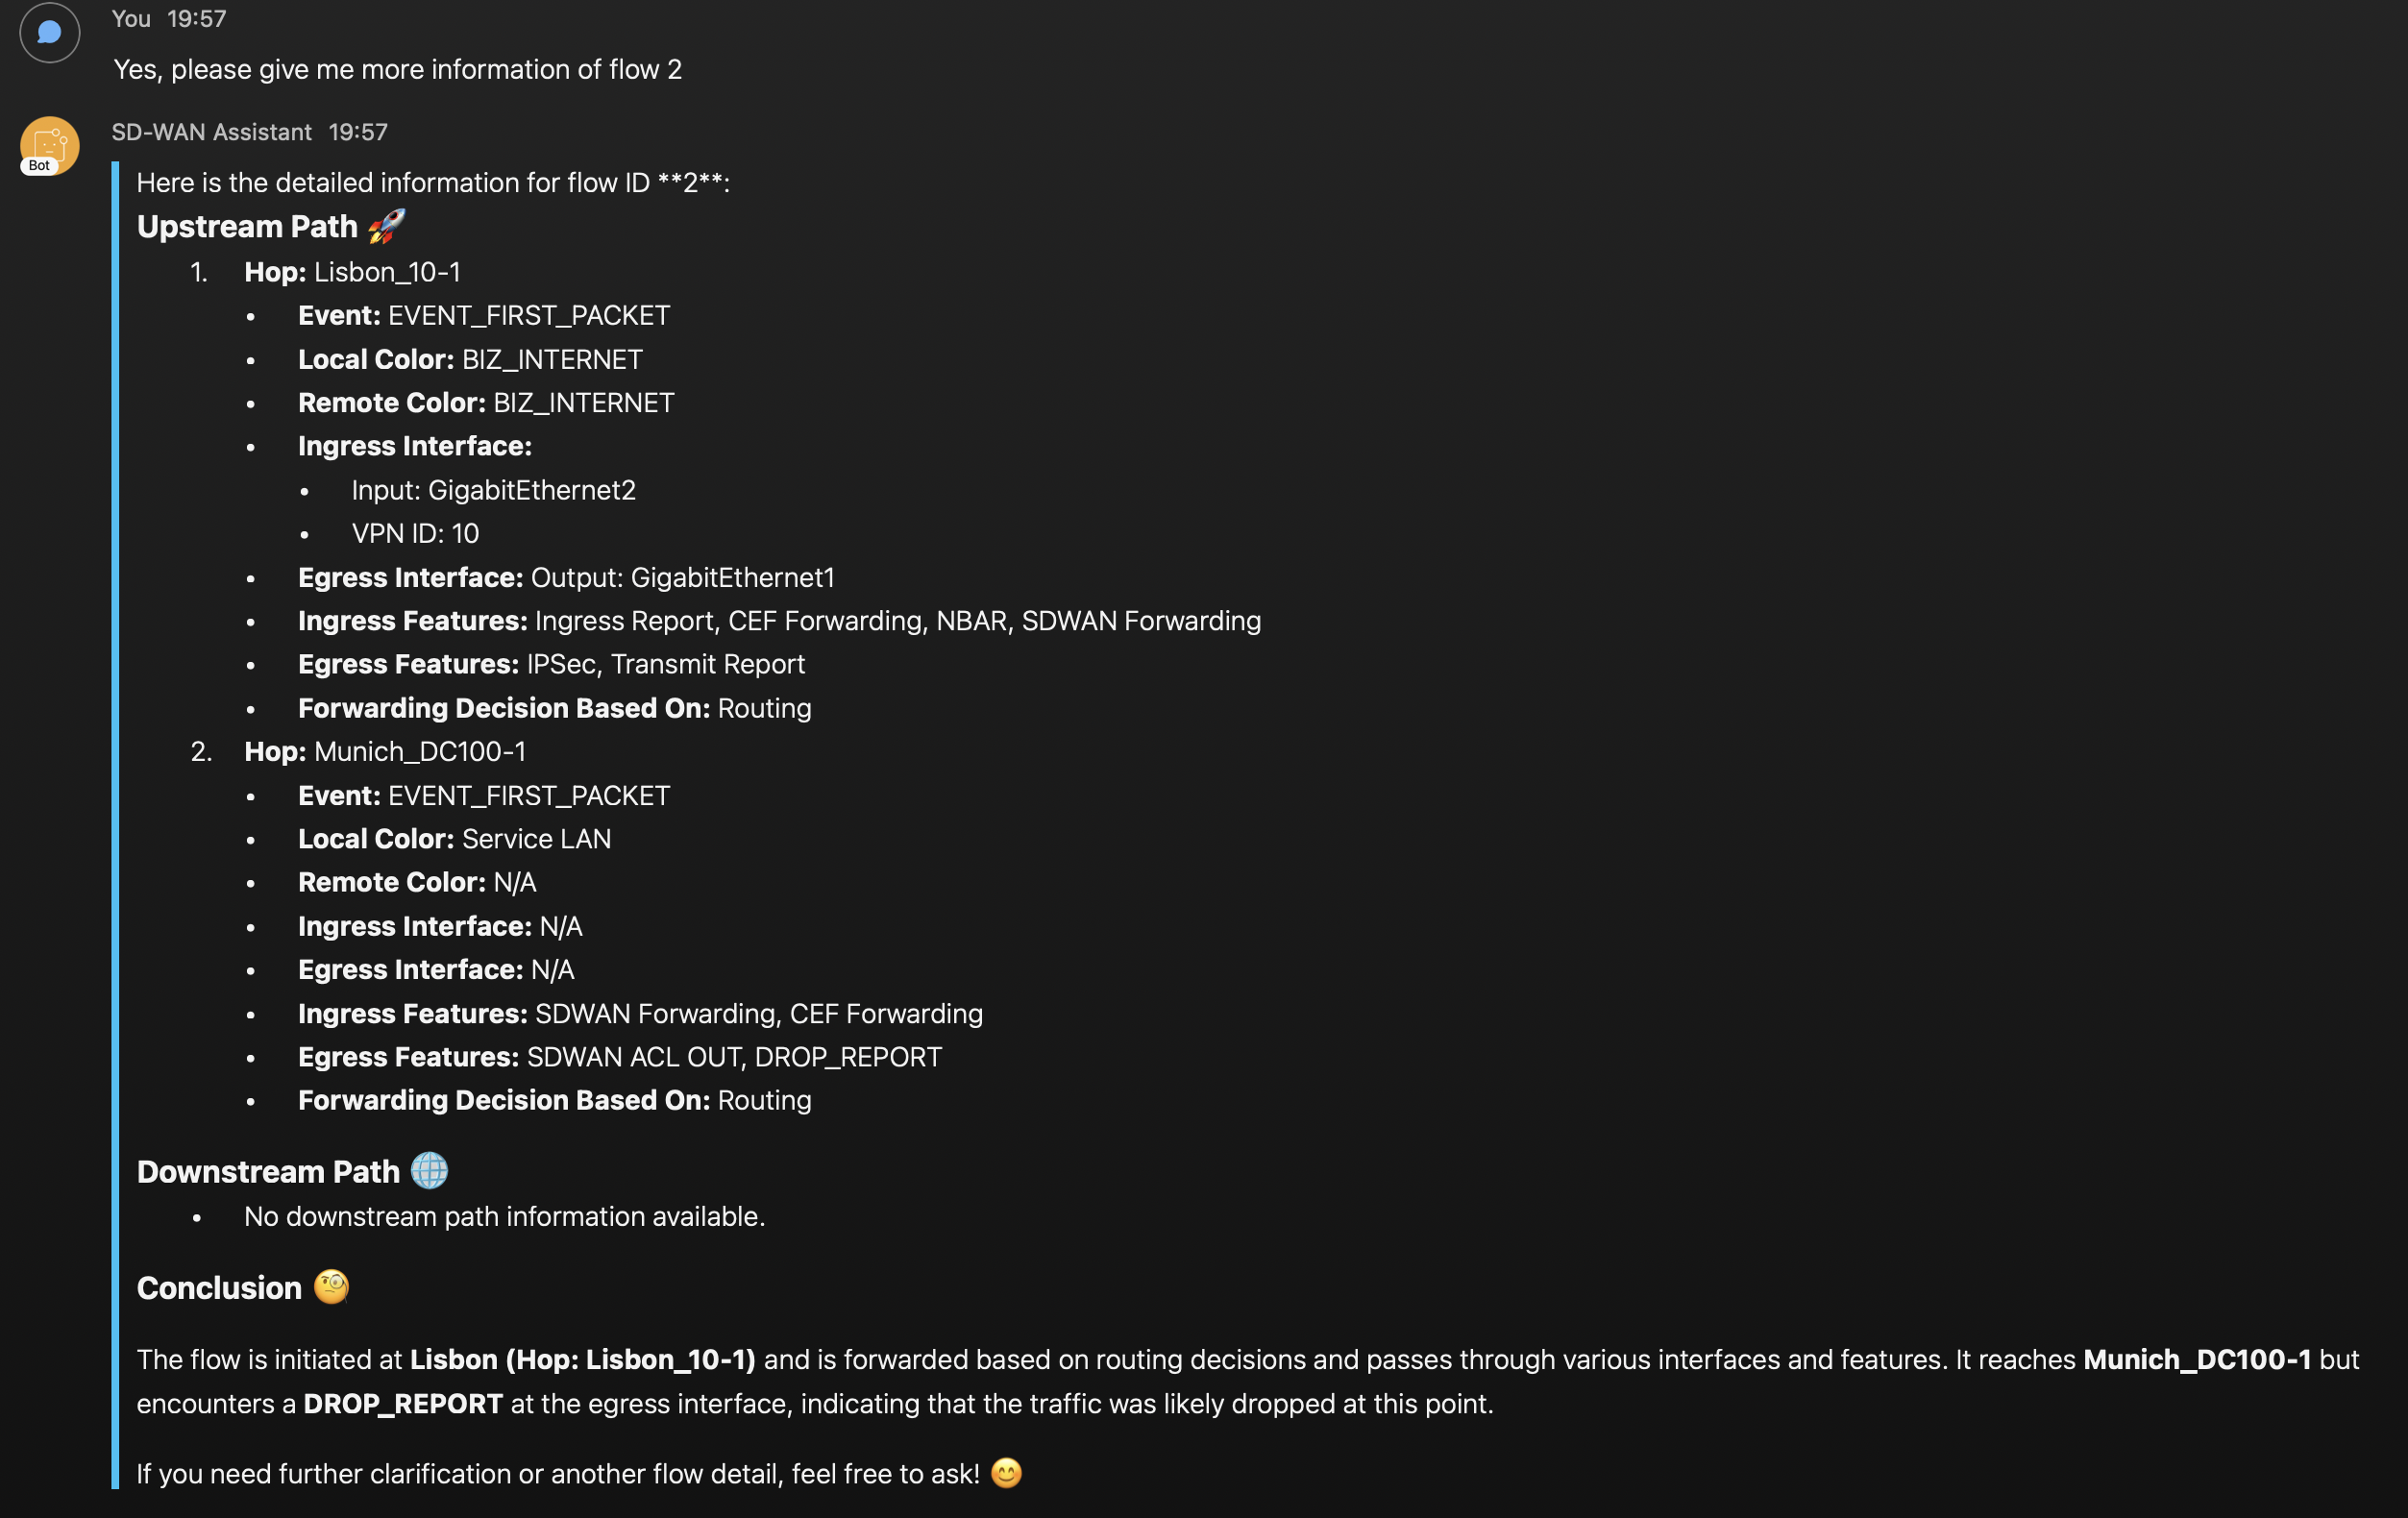
Finally, the assistant provides detailed information about the features that each of the hops apply to the traffic. On the second hop in Munich DC we can see that egress features show the SD-WAN ACL and a Drop Report. The assistant provides its own conclusion and it is also suspecting that Munich router is dropping the traffic. With a little bit more work, the agent could be able to tell the name of the ACL and sequence number that is dropping the traffic. We have successfully identified the root of the issue!! 😀 🎉
Lessons learned
- When I started, I wanted to be super cautious with the credits ($$) so I was using gpt-3.5-turbo-16k that is cheaper but also less intelligent. At some point, I faced issues with the LLM getting into a loop of problems, I decided to test out gpt-4o and felt a difference on the way the agent was reasoning.
- Initially, I was using an LLM temperature = 0, this was ok, but the responses were lacking variety and details, I needed to make it more chatty. Tweaking the temperature = 0.9 gave me a good balance between chattiness and correctness (although sometimes the agent still gives information that is questionable based on the outputs)
- Troubleshooting problems could be difficult at times, mostly I relied on printing function outputs while the functions were executed and the agent printed on the terminal. It let me understand what tools the agent was using and the order. Also, I could see what the tools were returning. Here is an example:

The text in green indicate the tools the agent is accessing. The yellow text is the information returned by a function. In this case, we can see that the agent called "get_entry_time_and_state" function so it can get information needed to call the next function "get_flow_detail"
There are better tools available to help with troubleshooting like LangSmith Tr acing, I will explore it for future use.
- The system prompt of my agent had to be refined several times, I often found that I needed to provide more details to handle certain situations correctly, especially when the output of a function was needed to call another one or to handle unexpected situations. I think it can still be improved, in fact I want to write a totally different prompt to try and make the agent run all of the tools by itself and just return a conclusion after analyzing all the outputs.
Conclusion
All in all, it was a good (and long) exercise to learn and build my first assistant. I feel happy with the result as I was able to get to me objective. At the same time, I recognize there are a lot of things that could be improved to make the results more reliable and meaningful. Also, there is much more information that NWPI can show, so the tools can definitely be extended.
As a next step, I am planning to learn LangChain properly and understand how can I implement multiple agents to enhance the functionality and reliability of my assistant.
I hope this post will help you in the same way that Cisco Live presentation helped me!